Stage 1 · Reference & concept exploration
Ideations & iterations
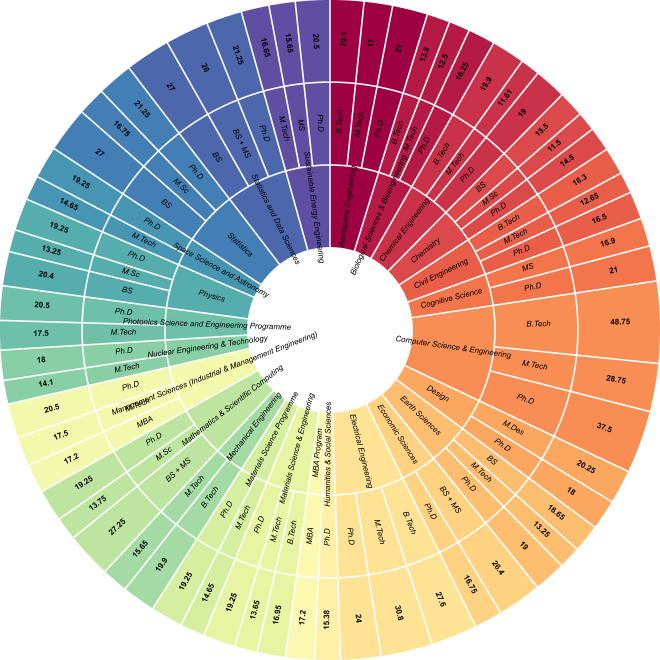
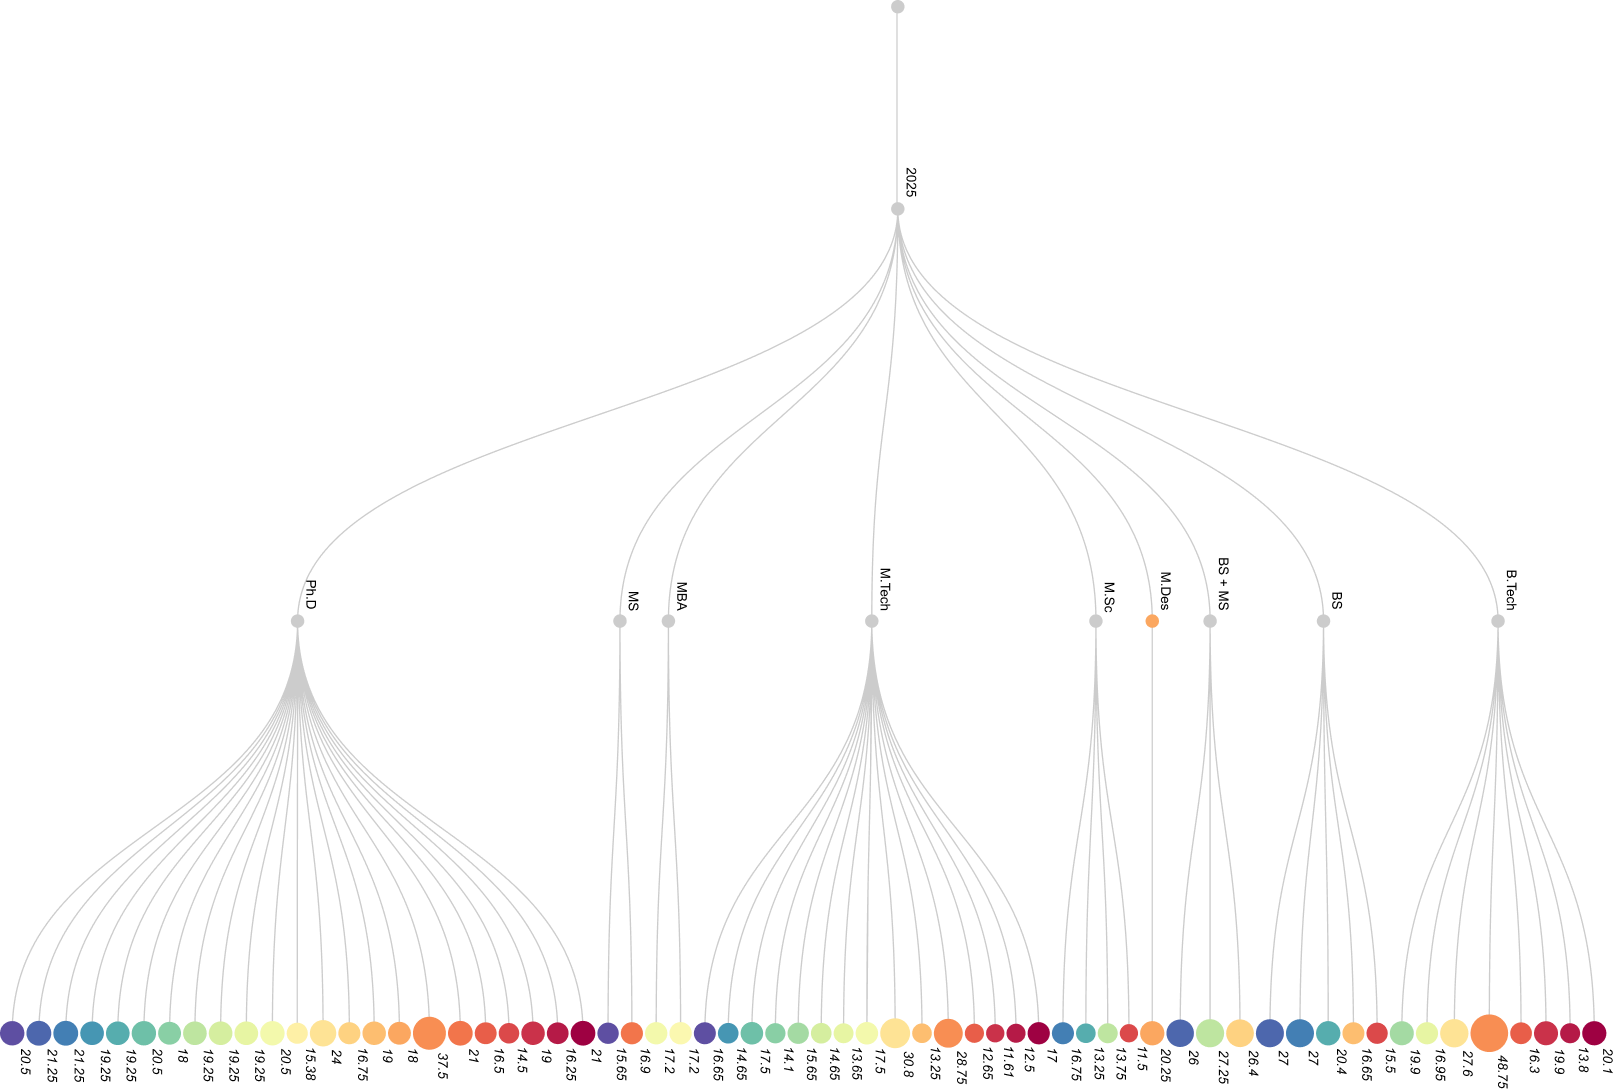
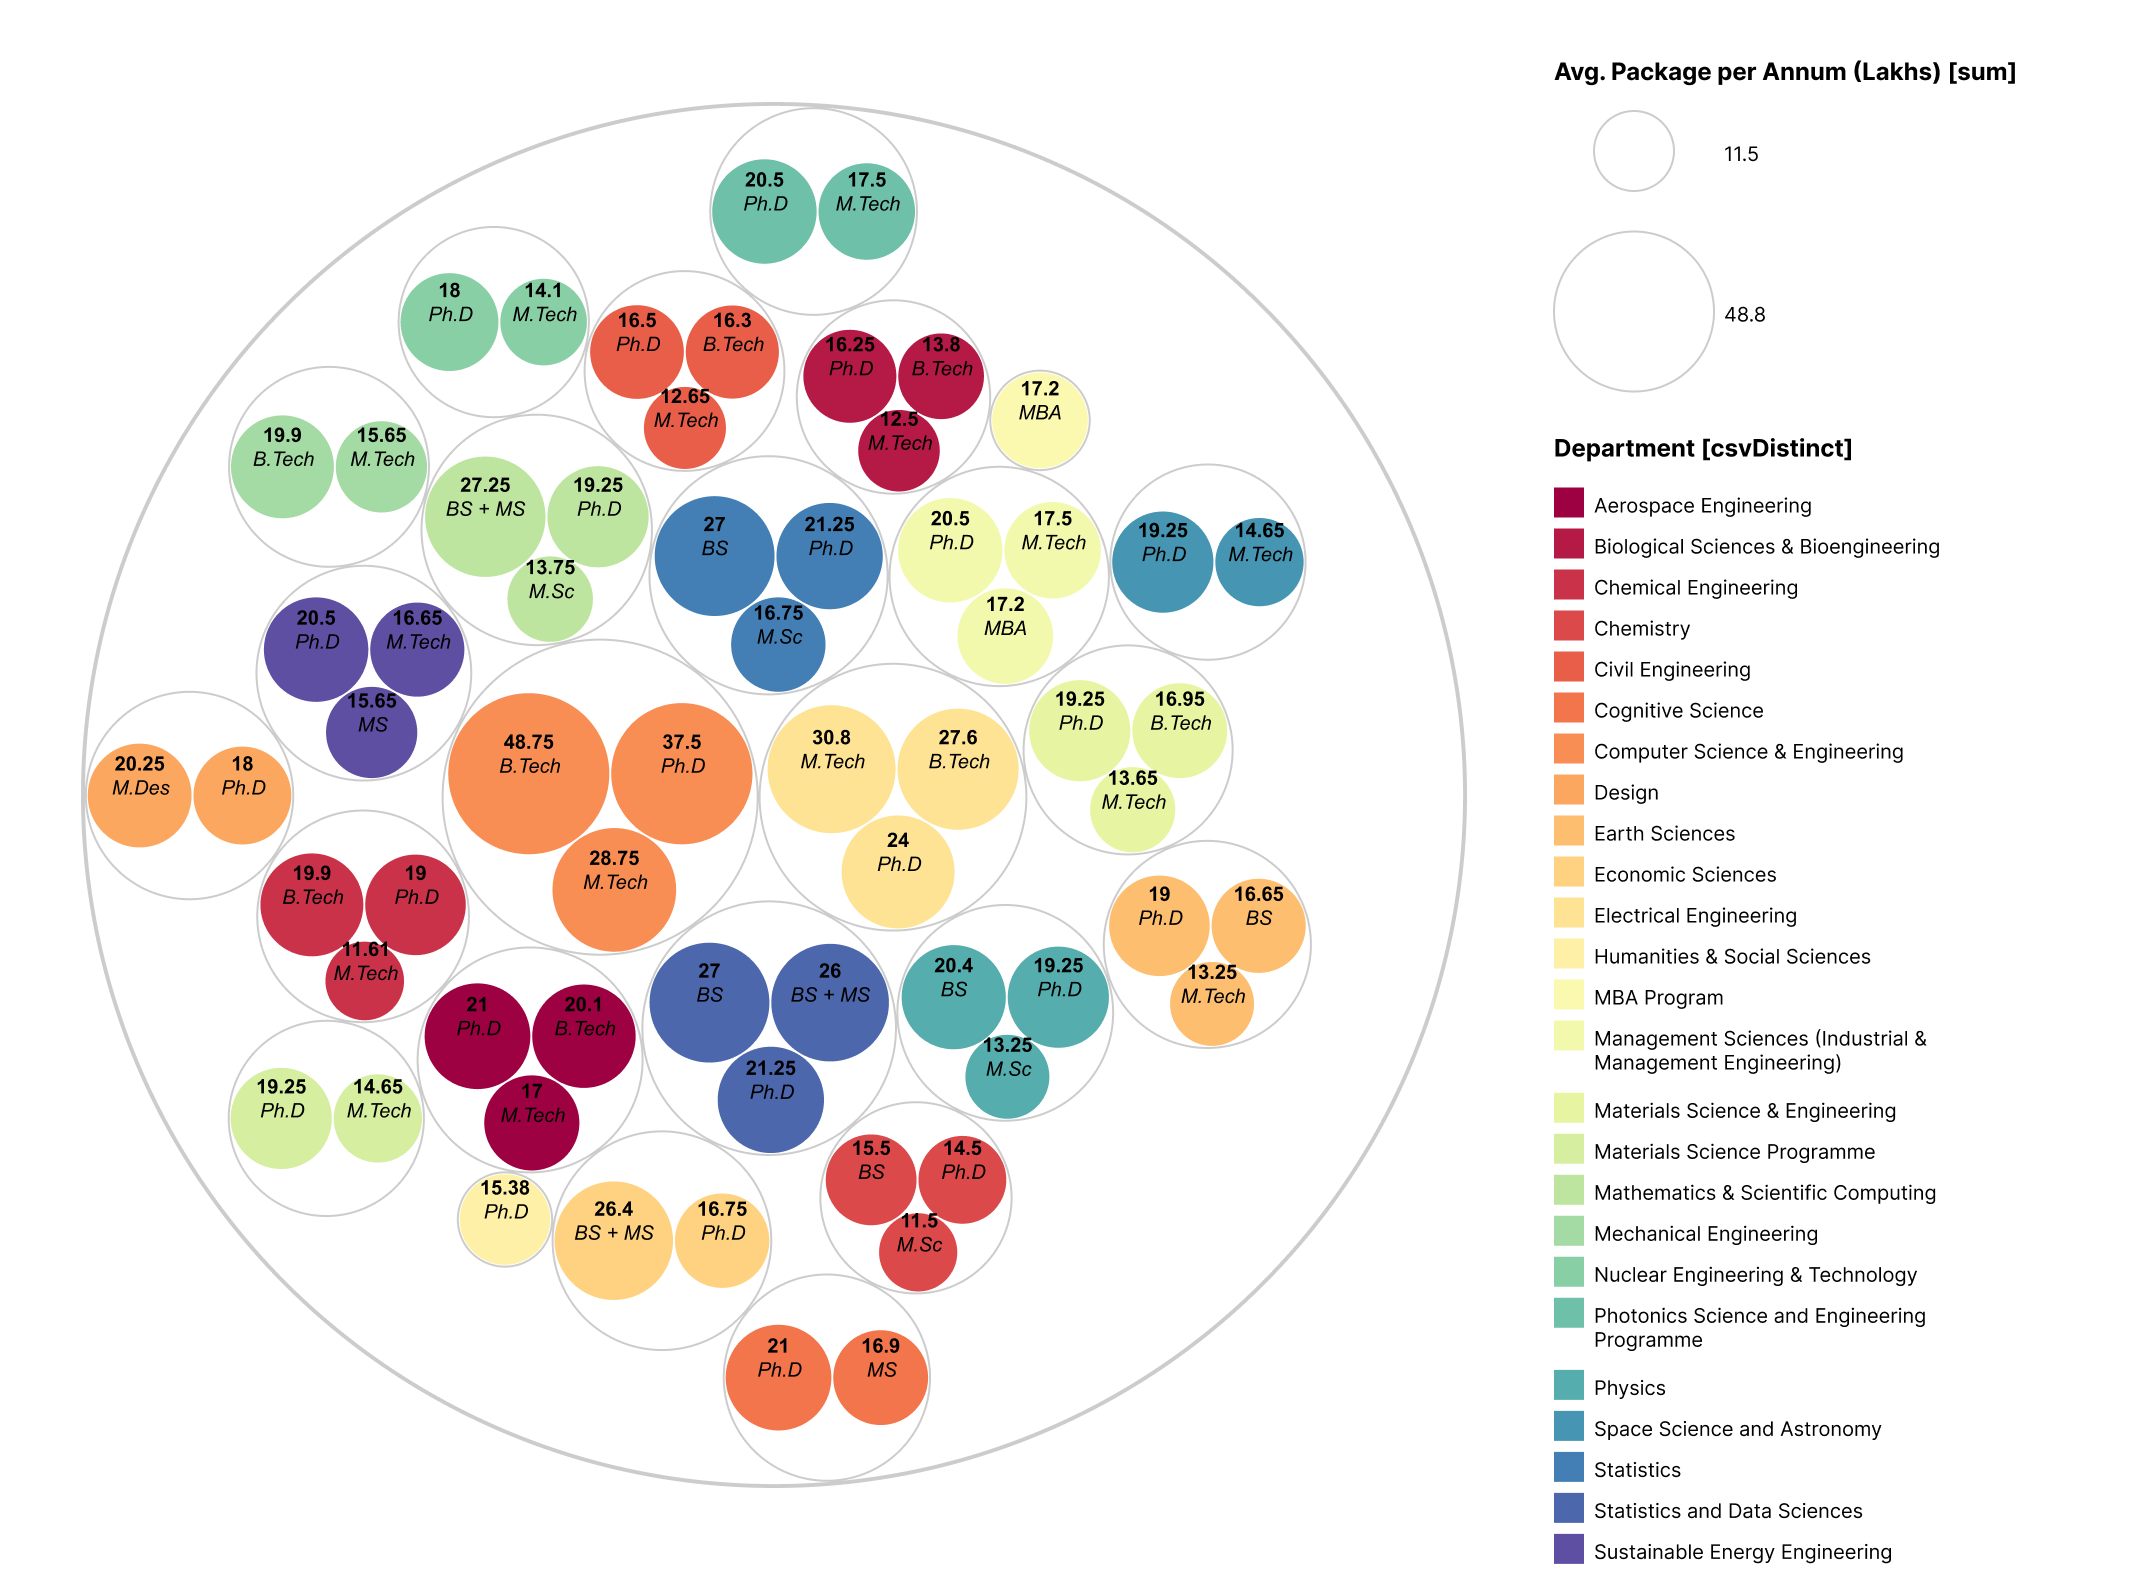
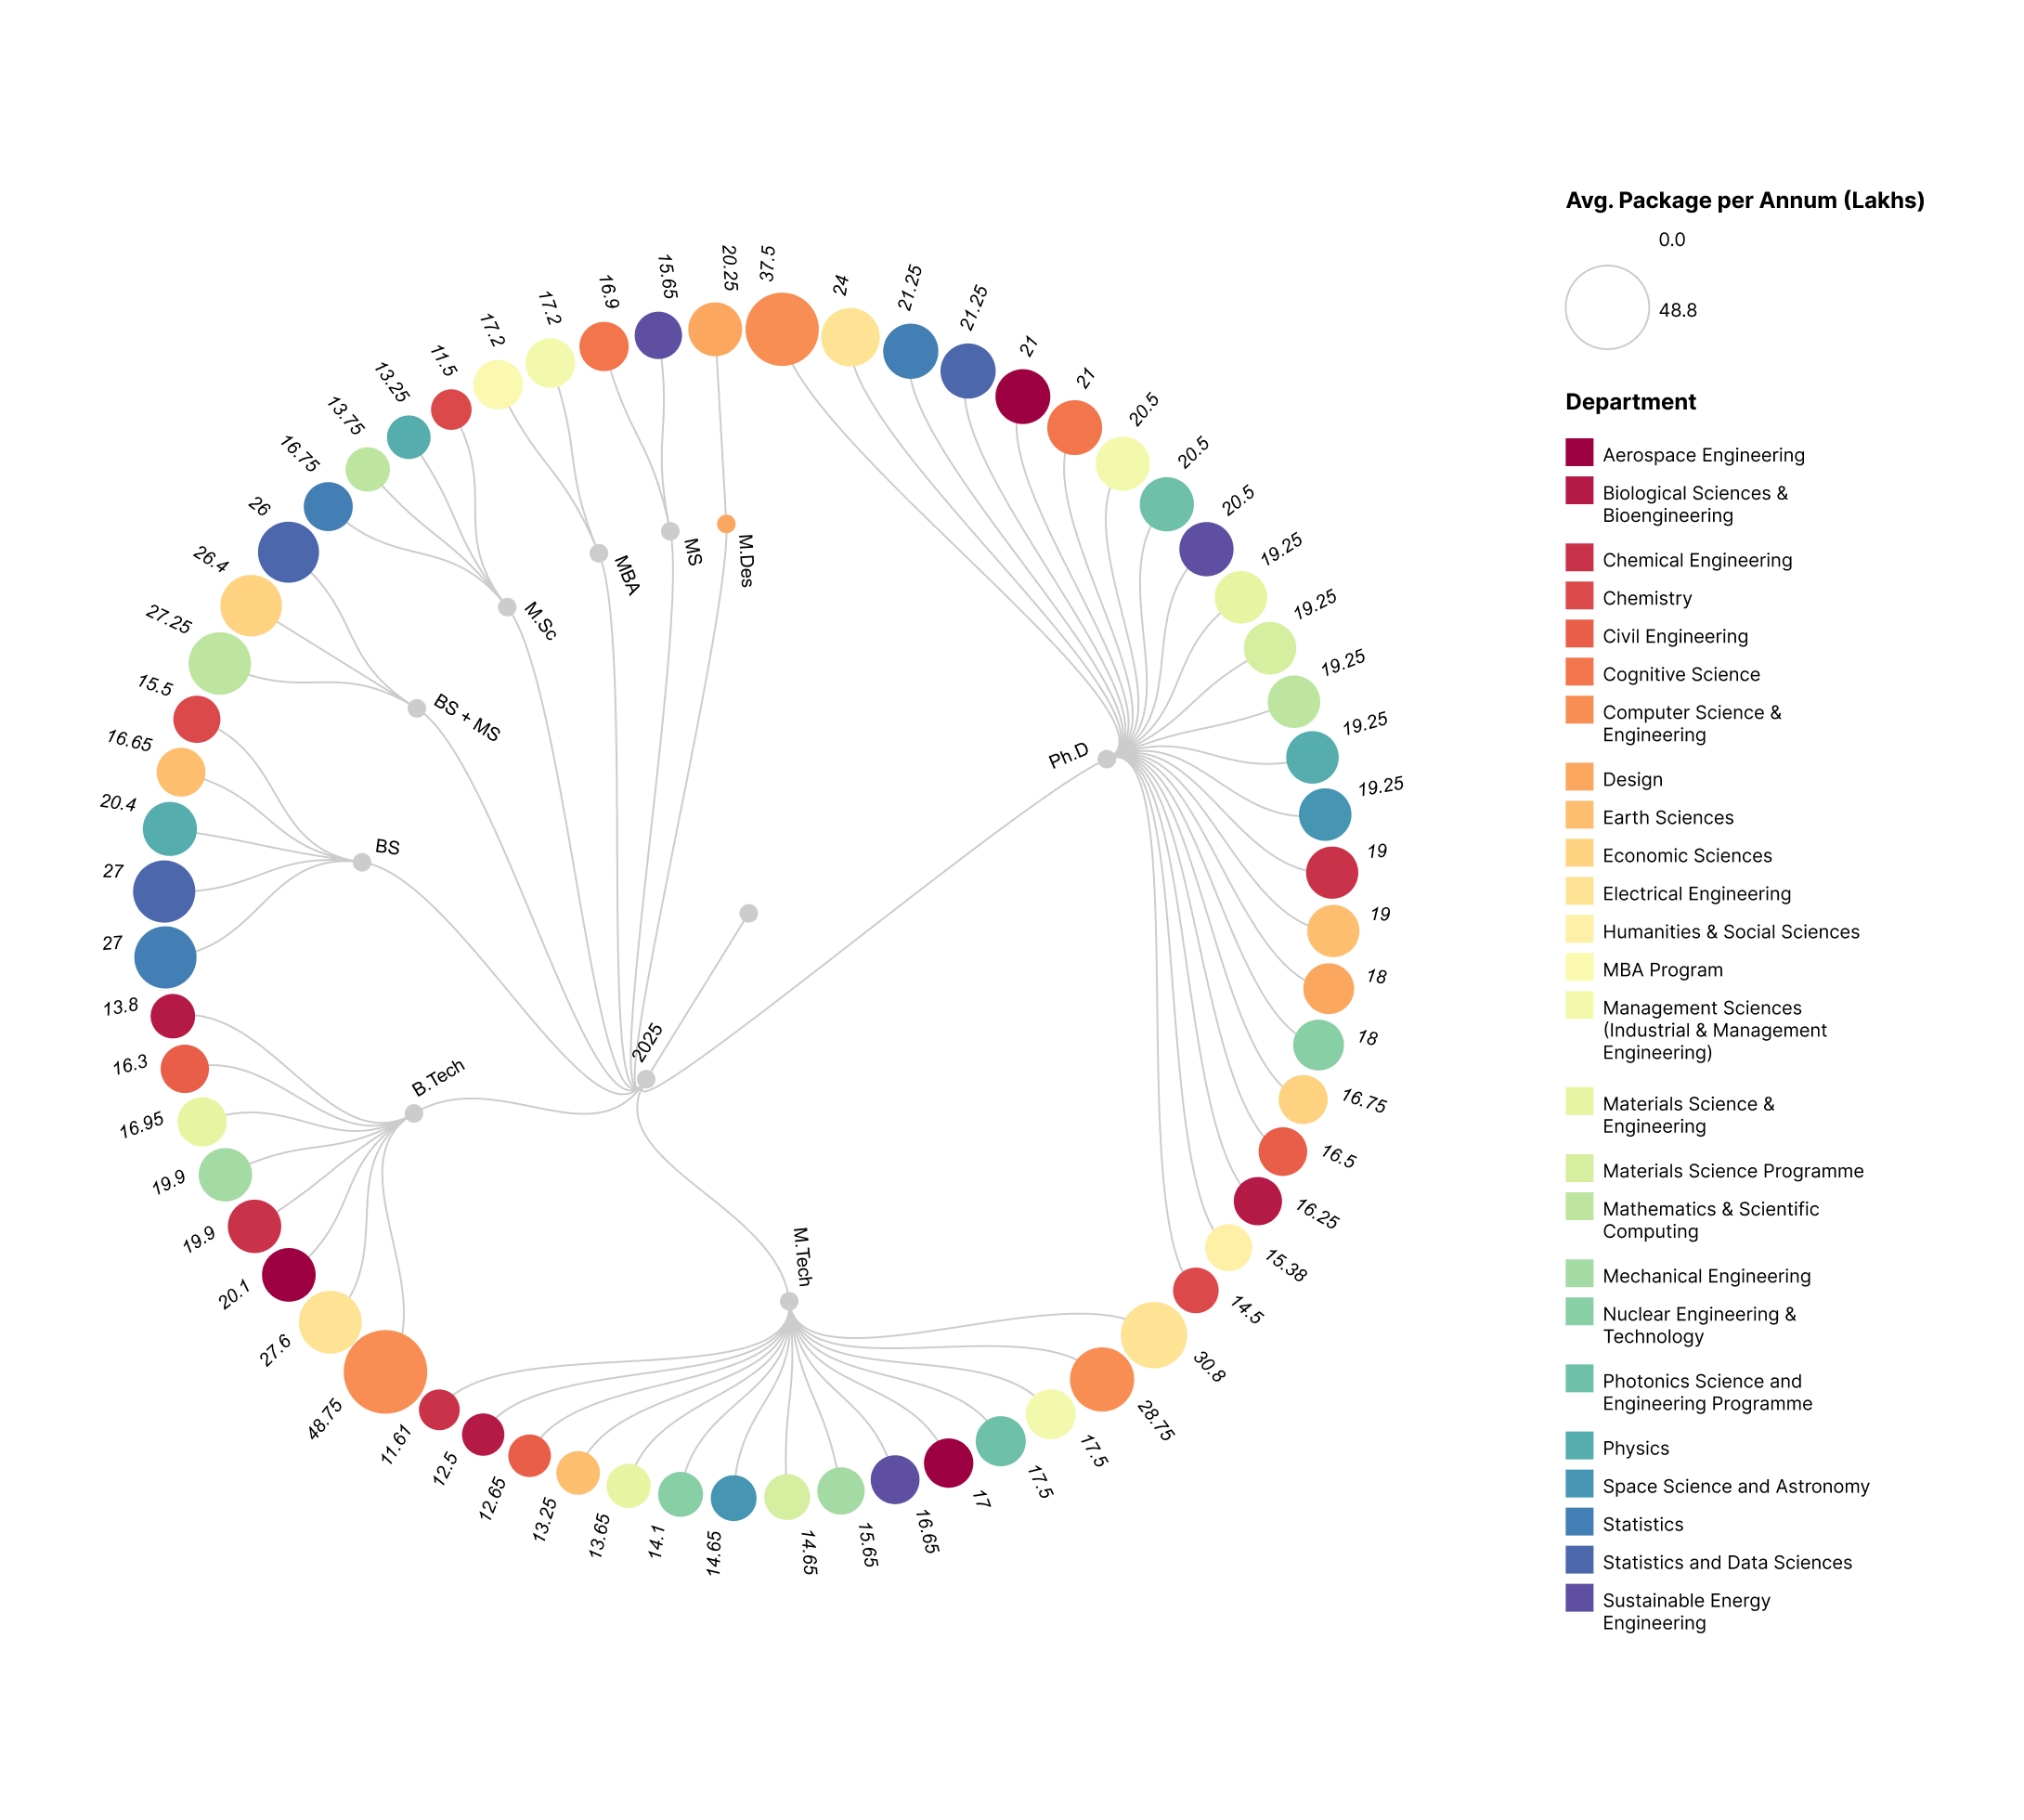
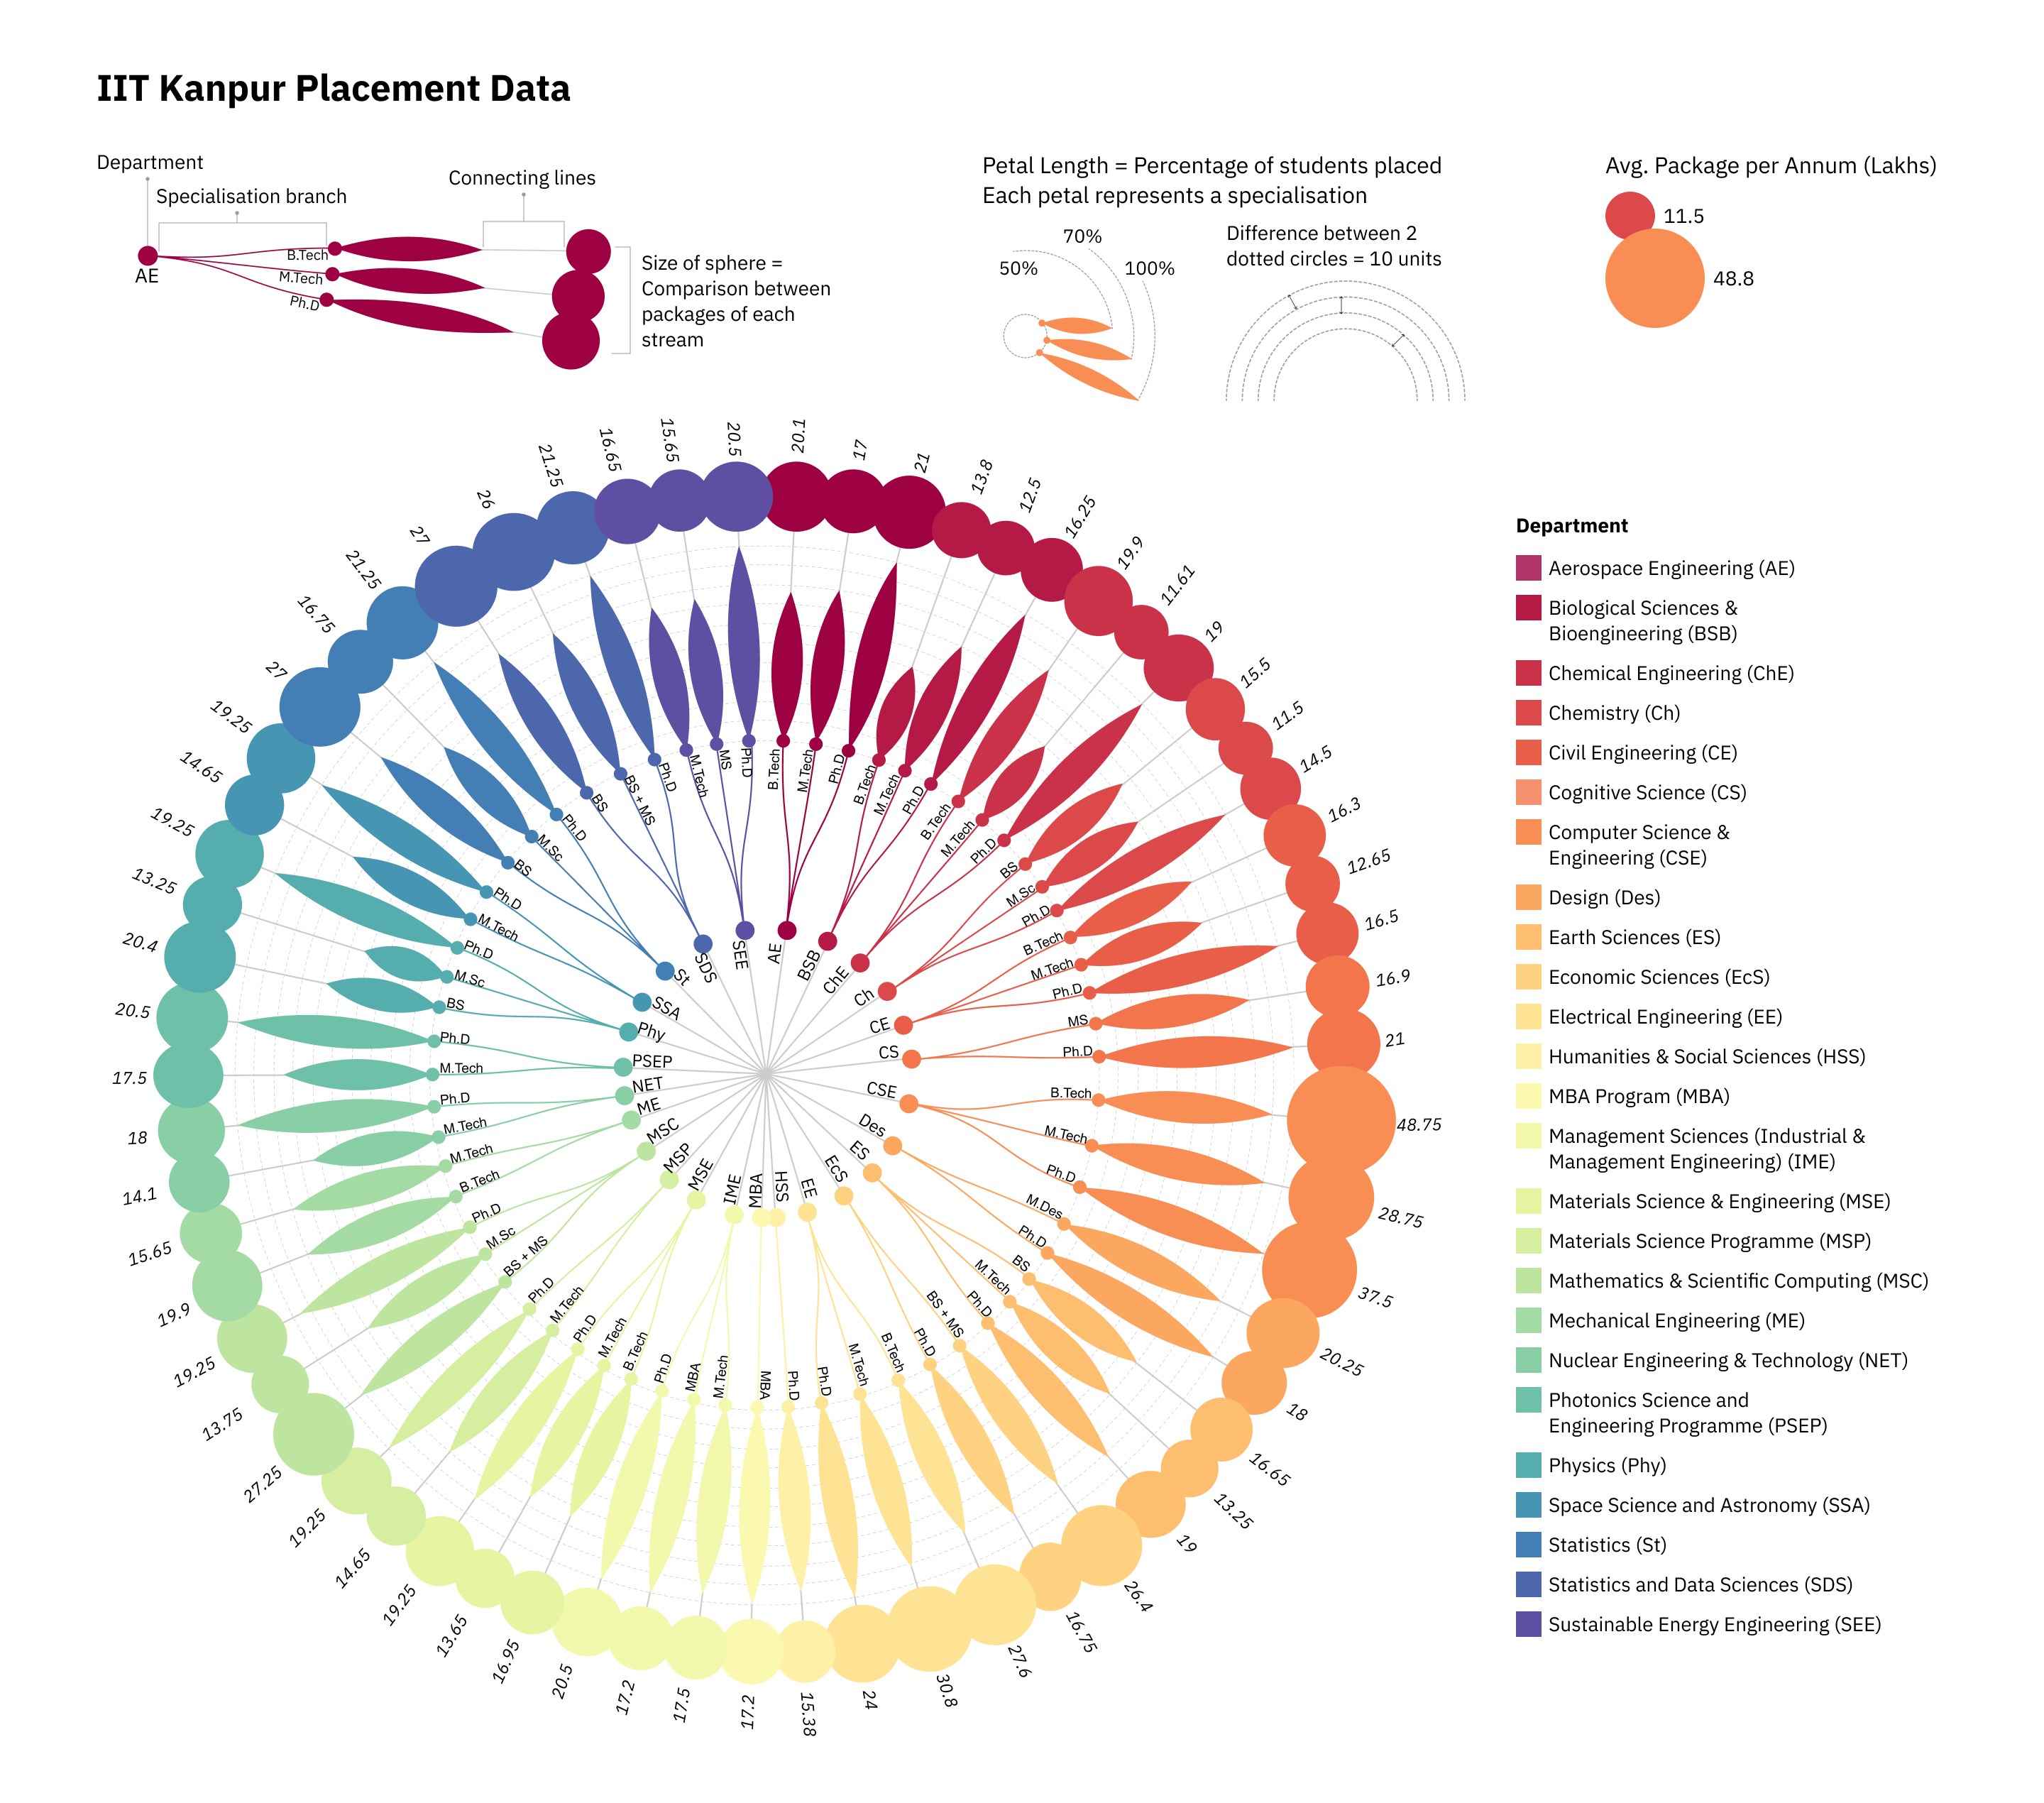
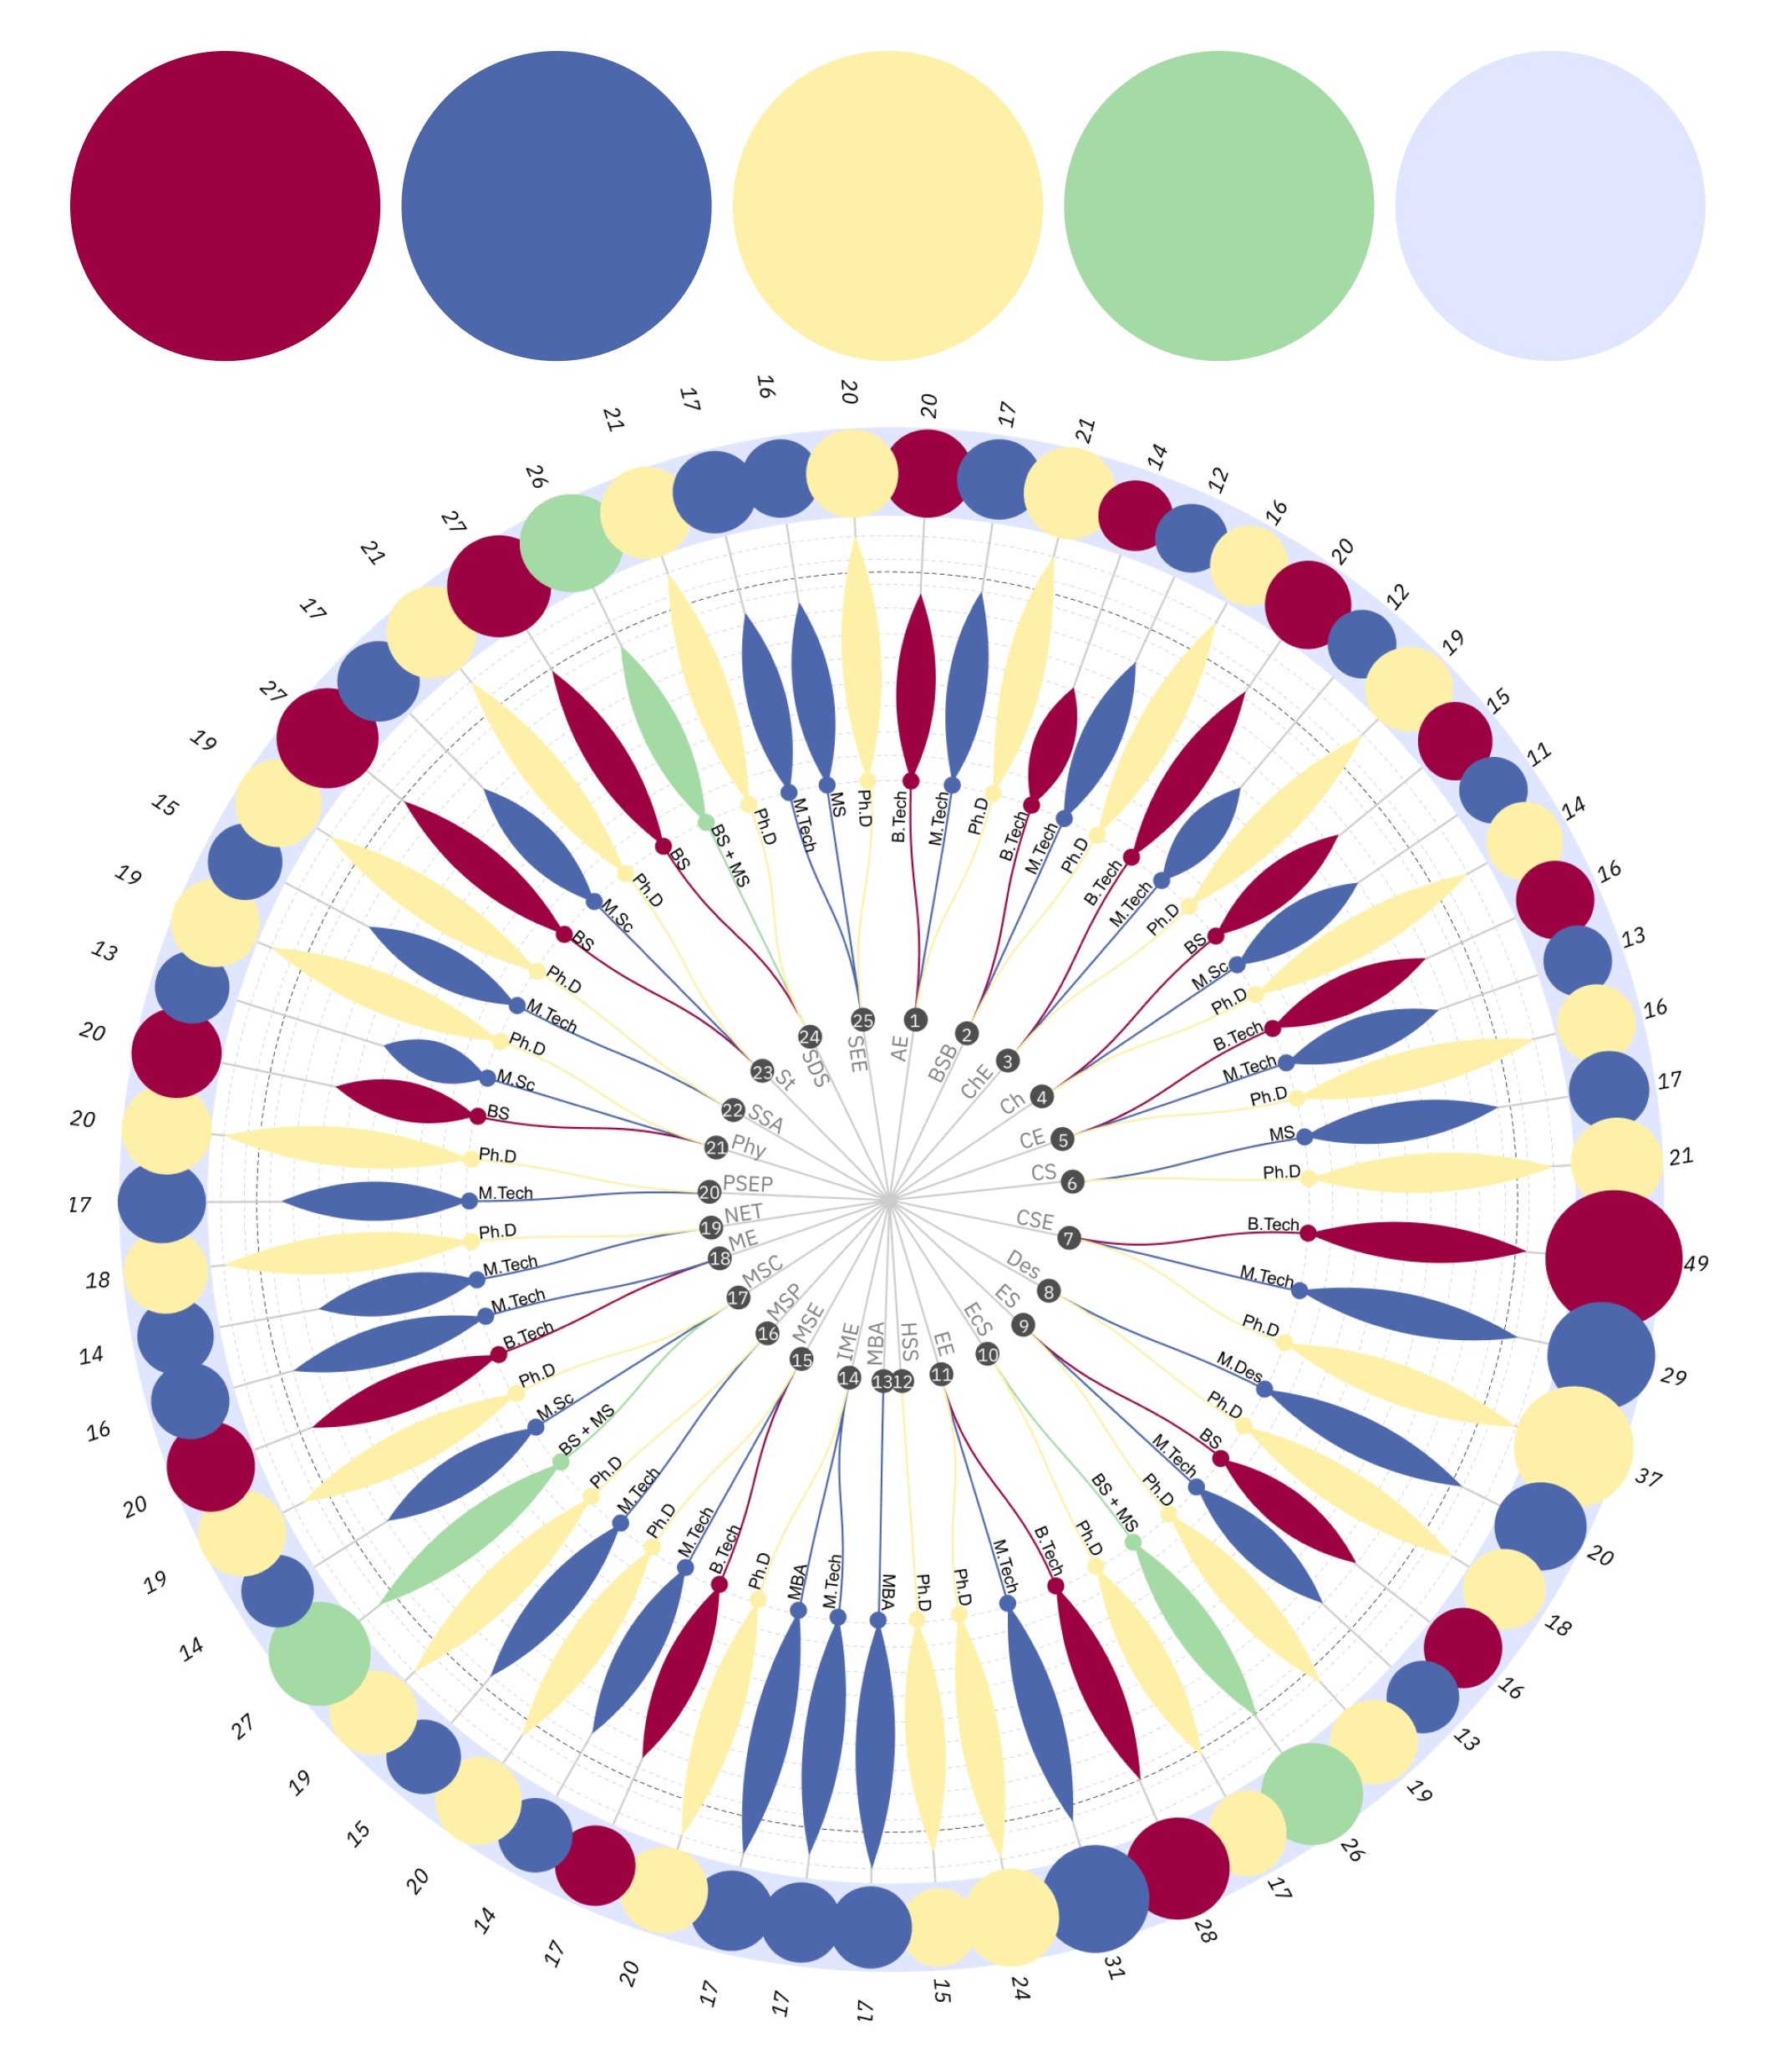
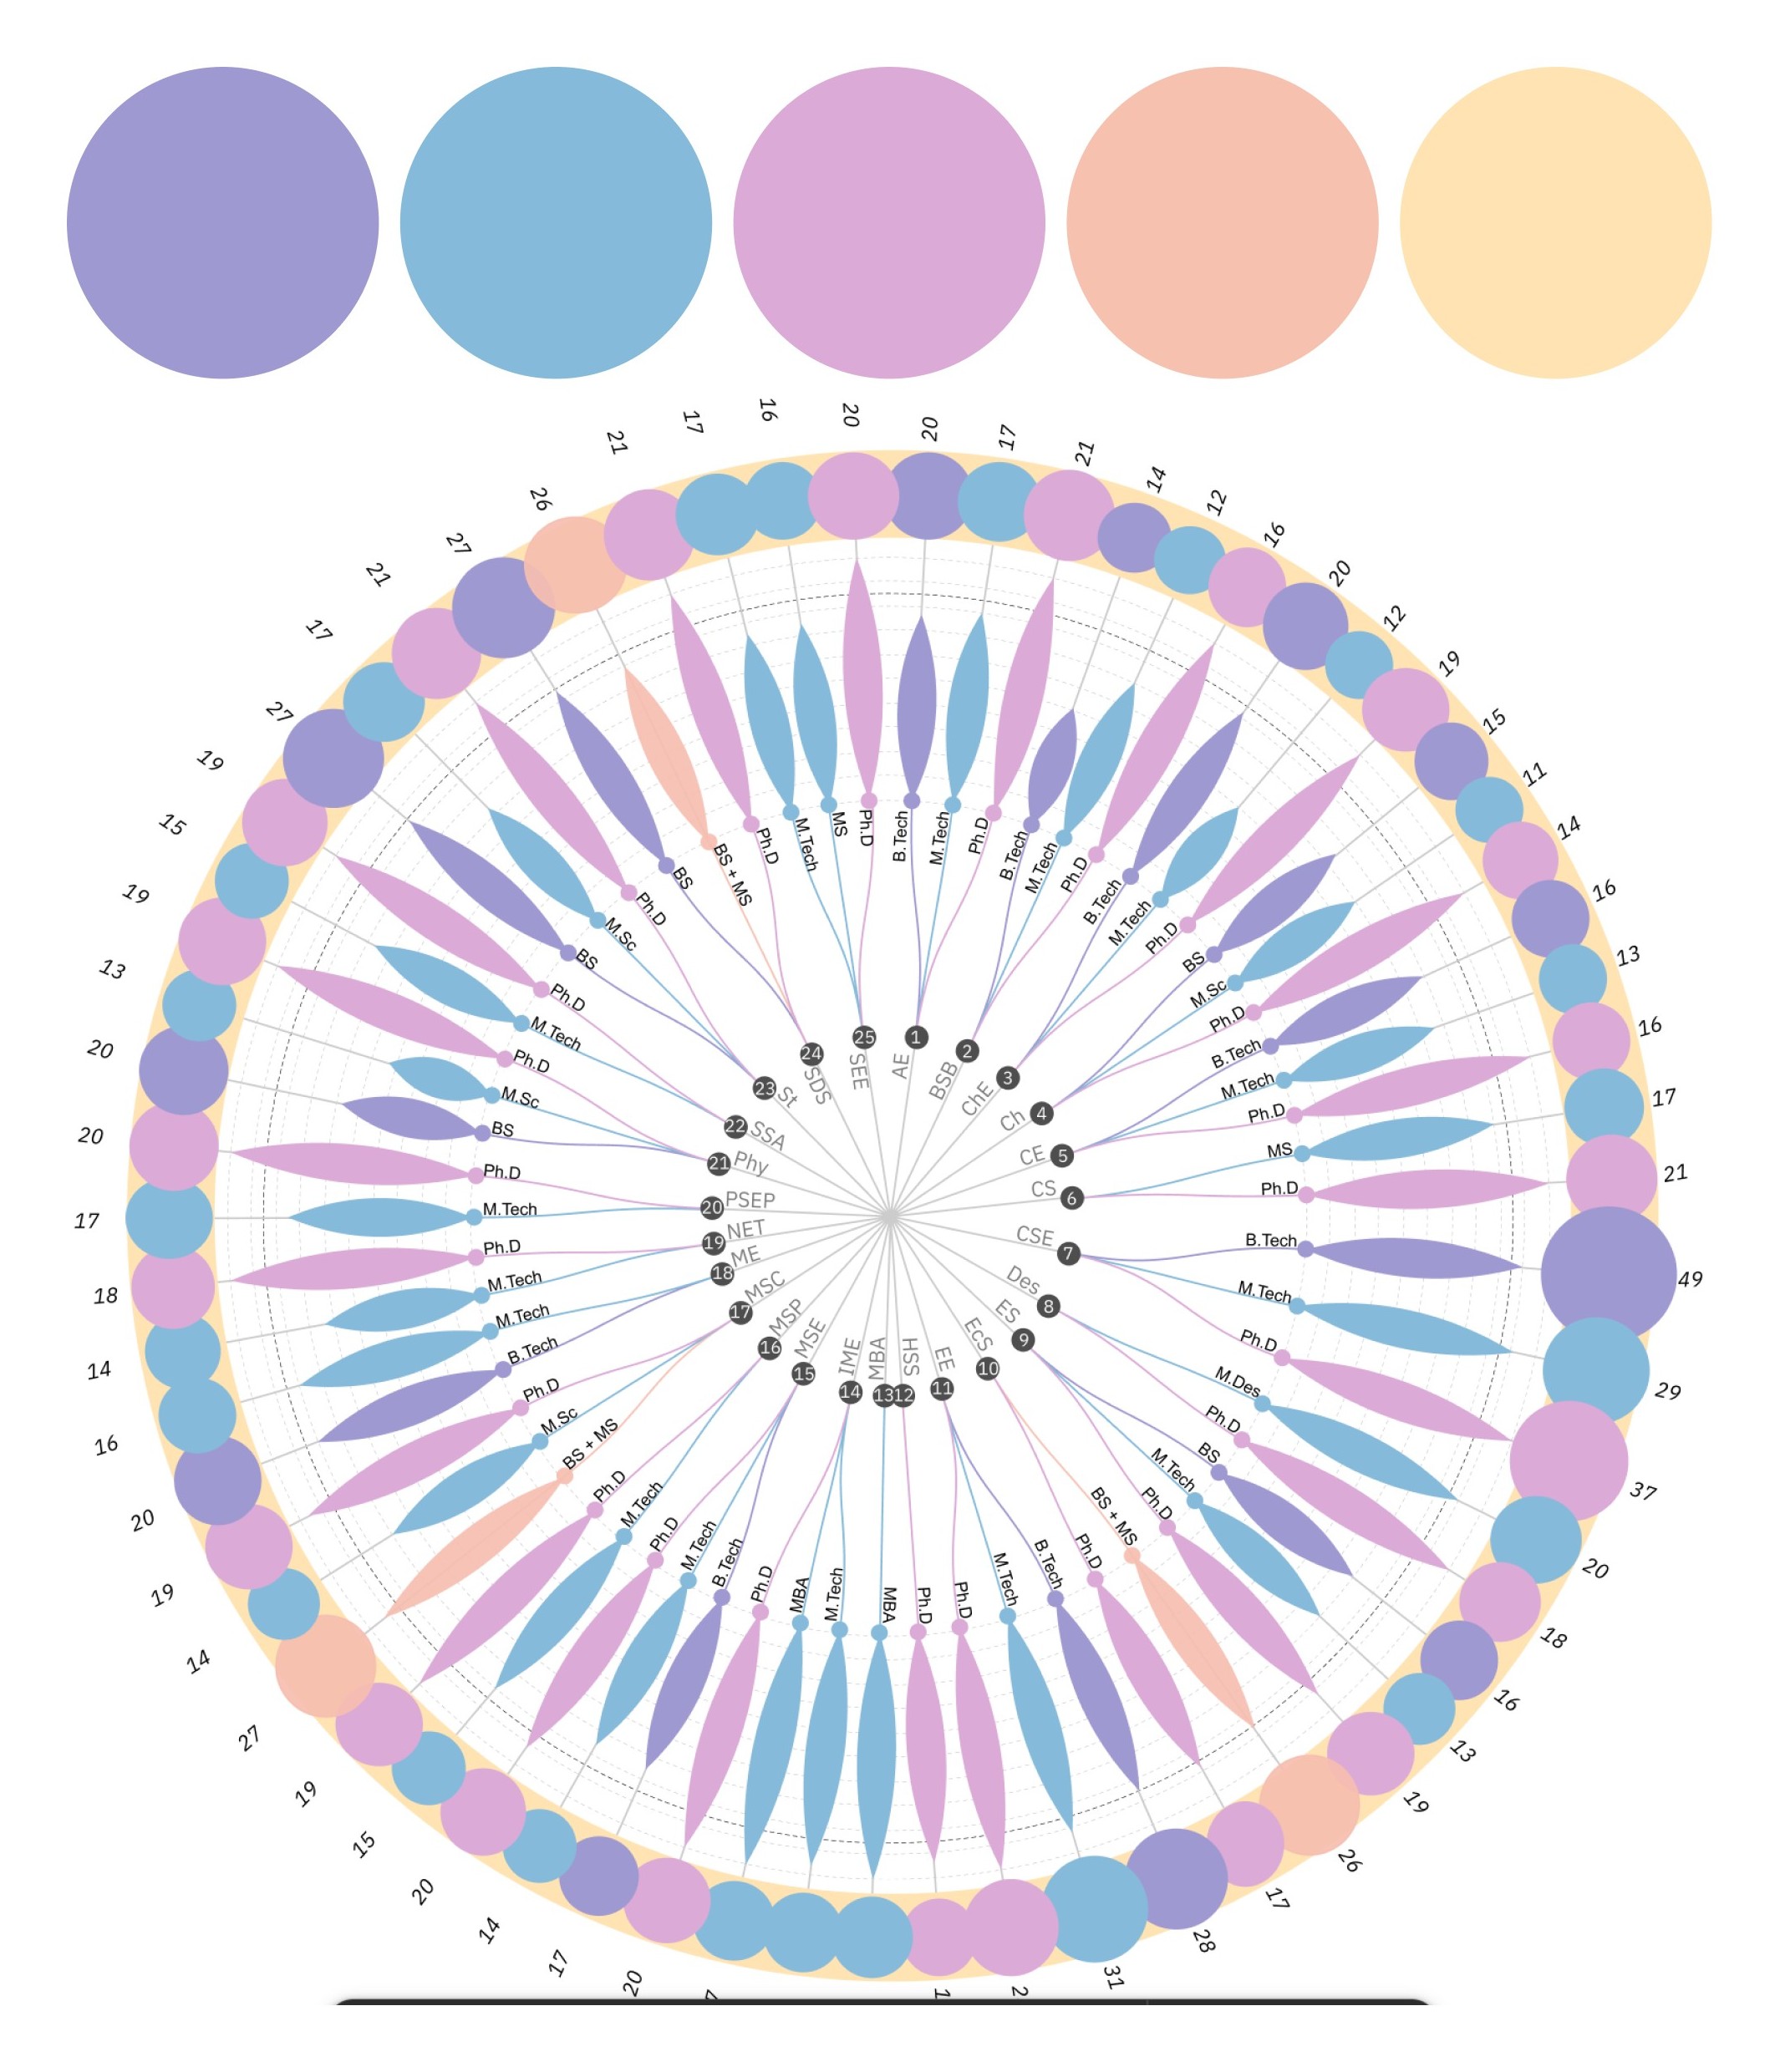
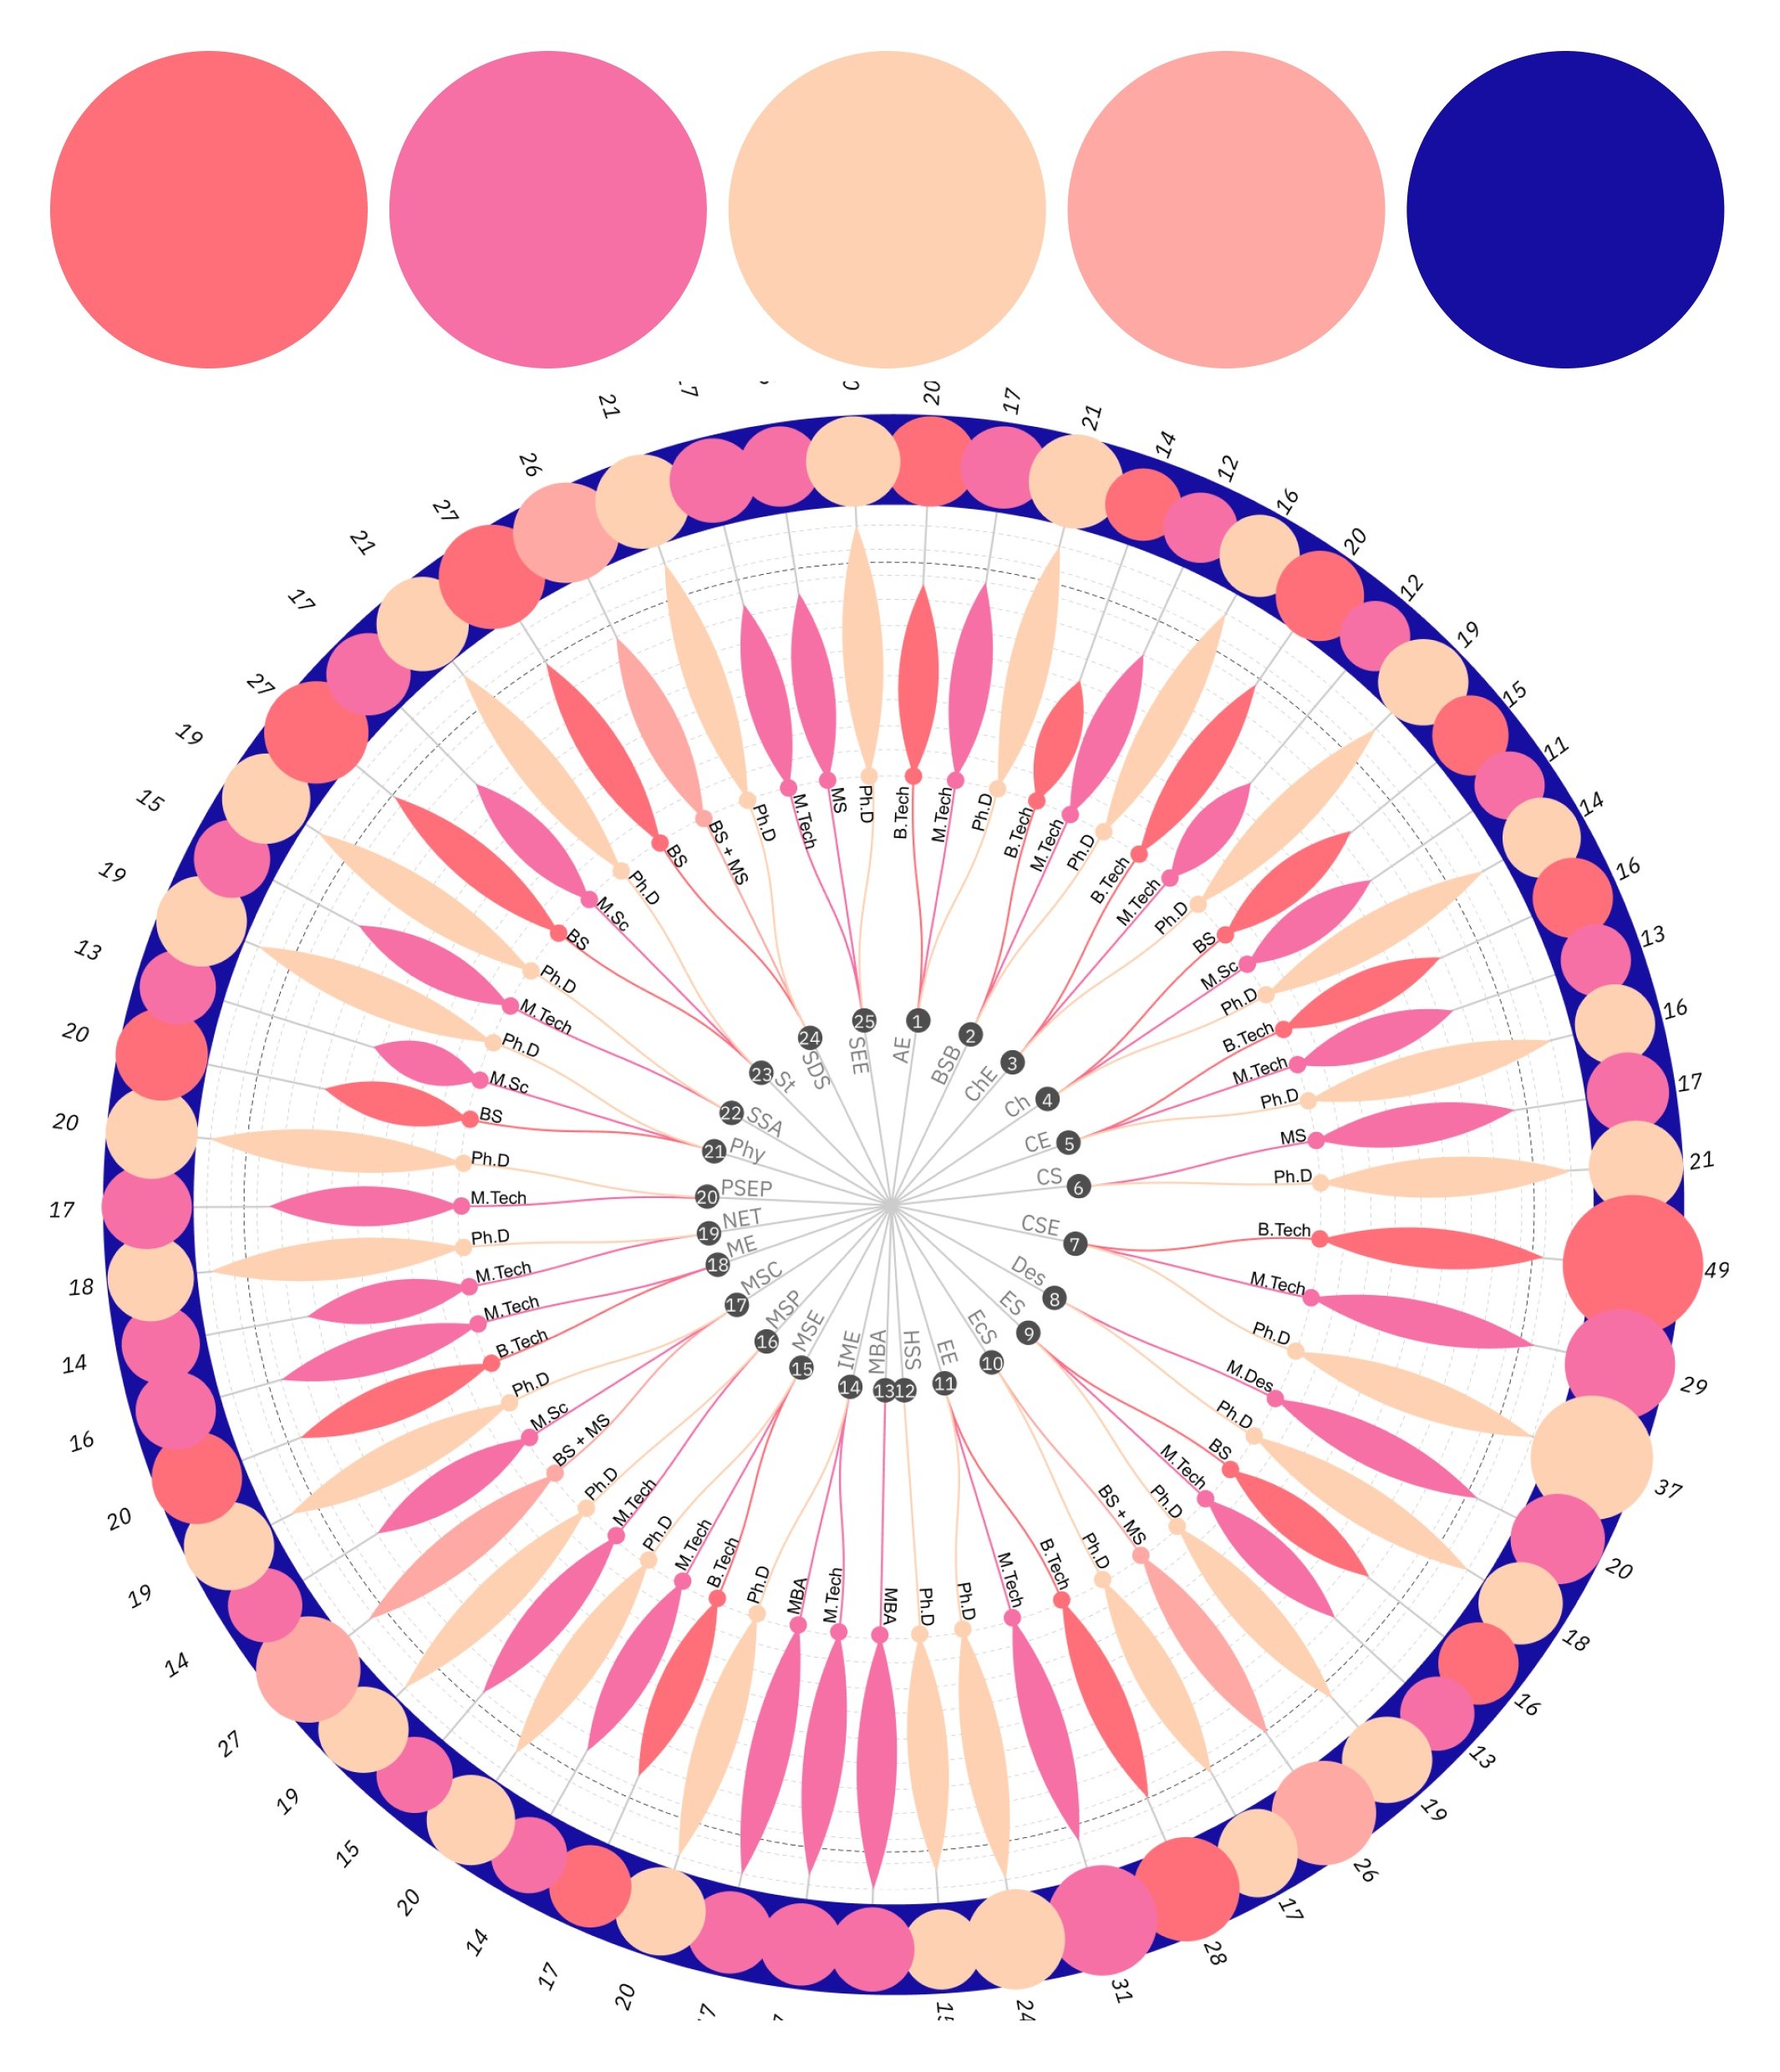
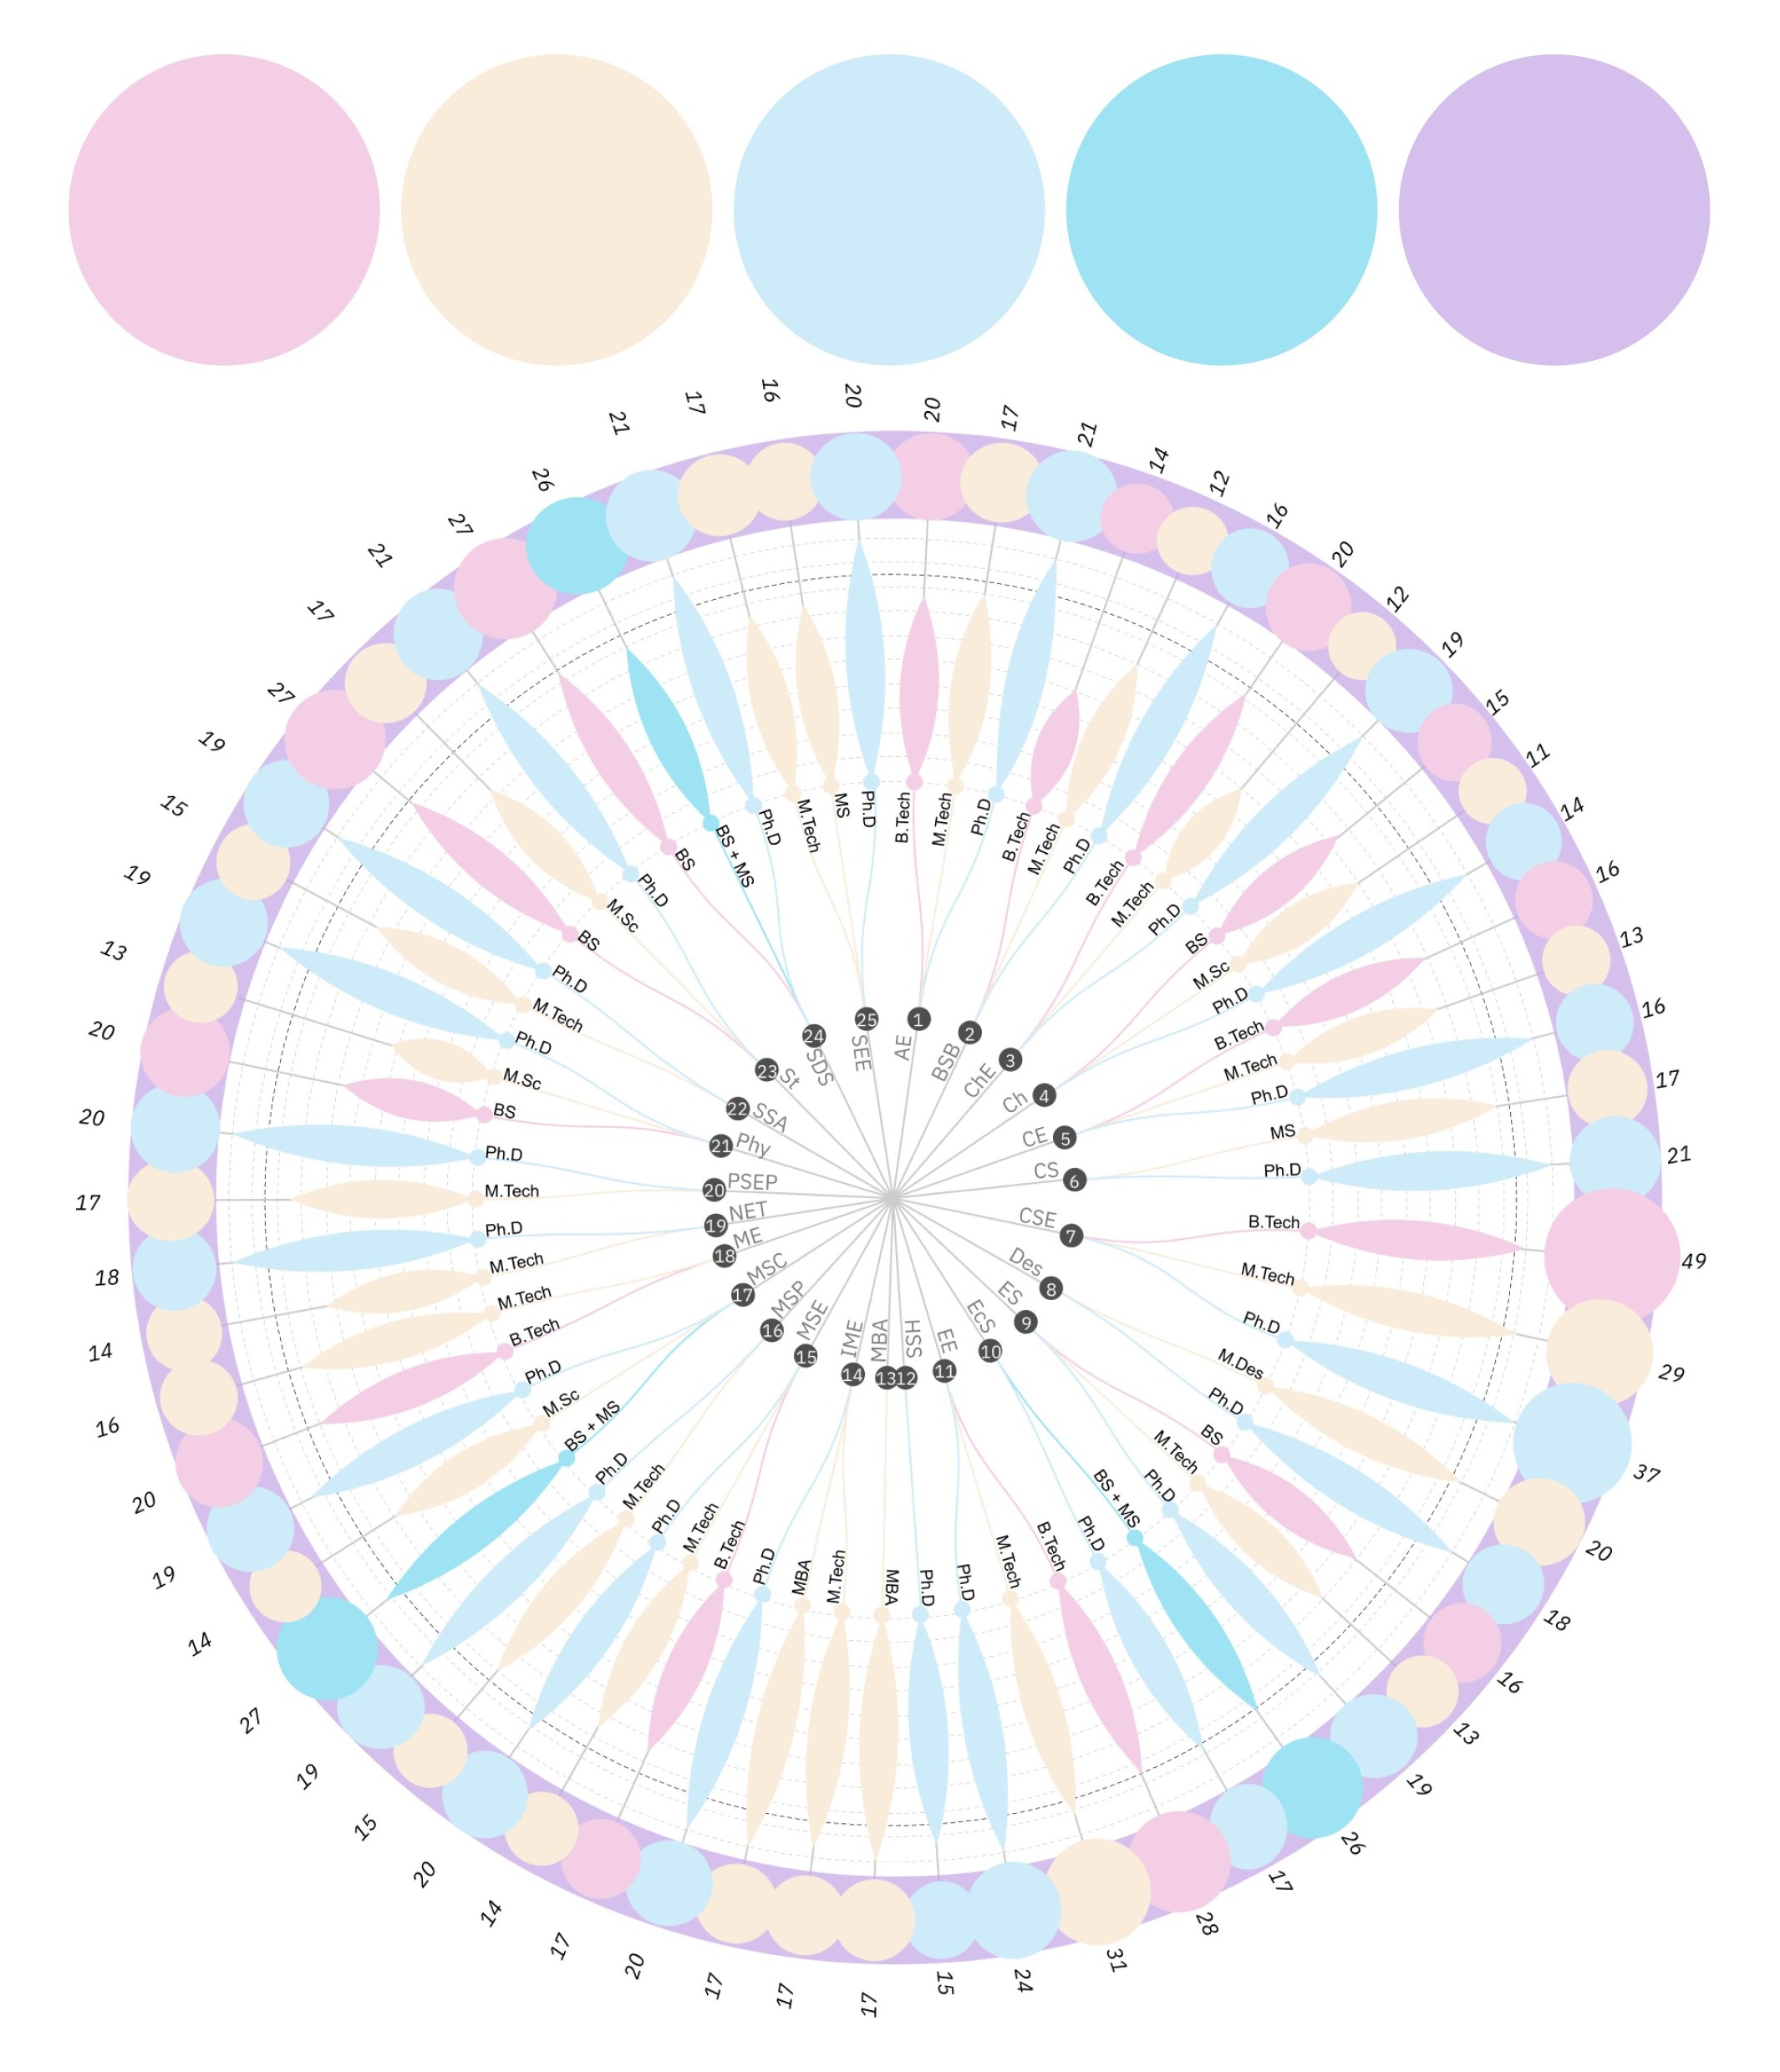
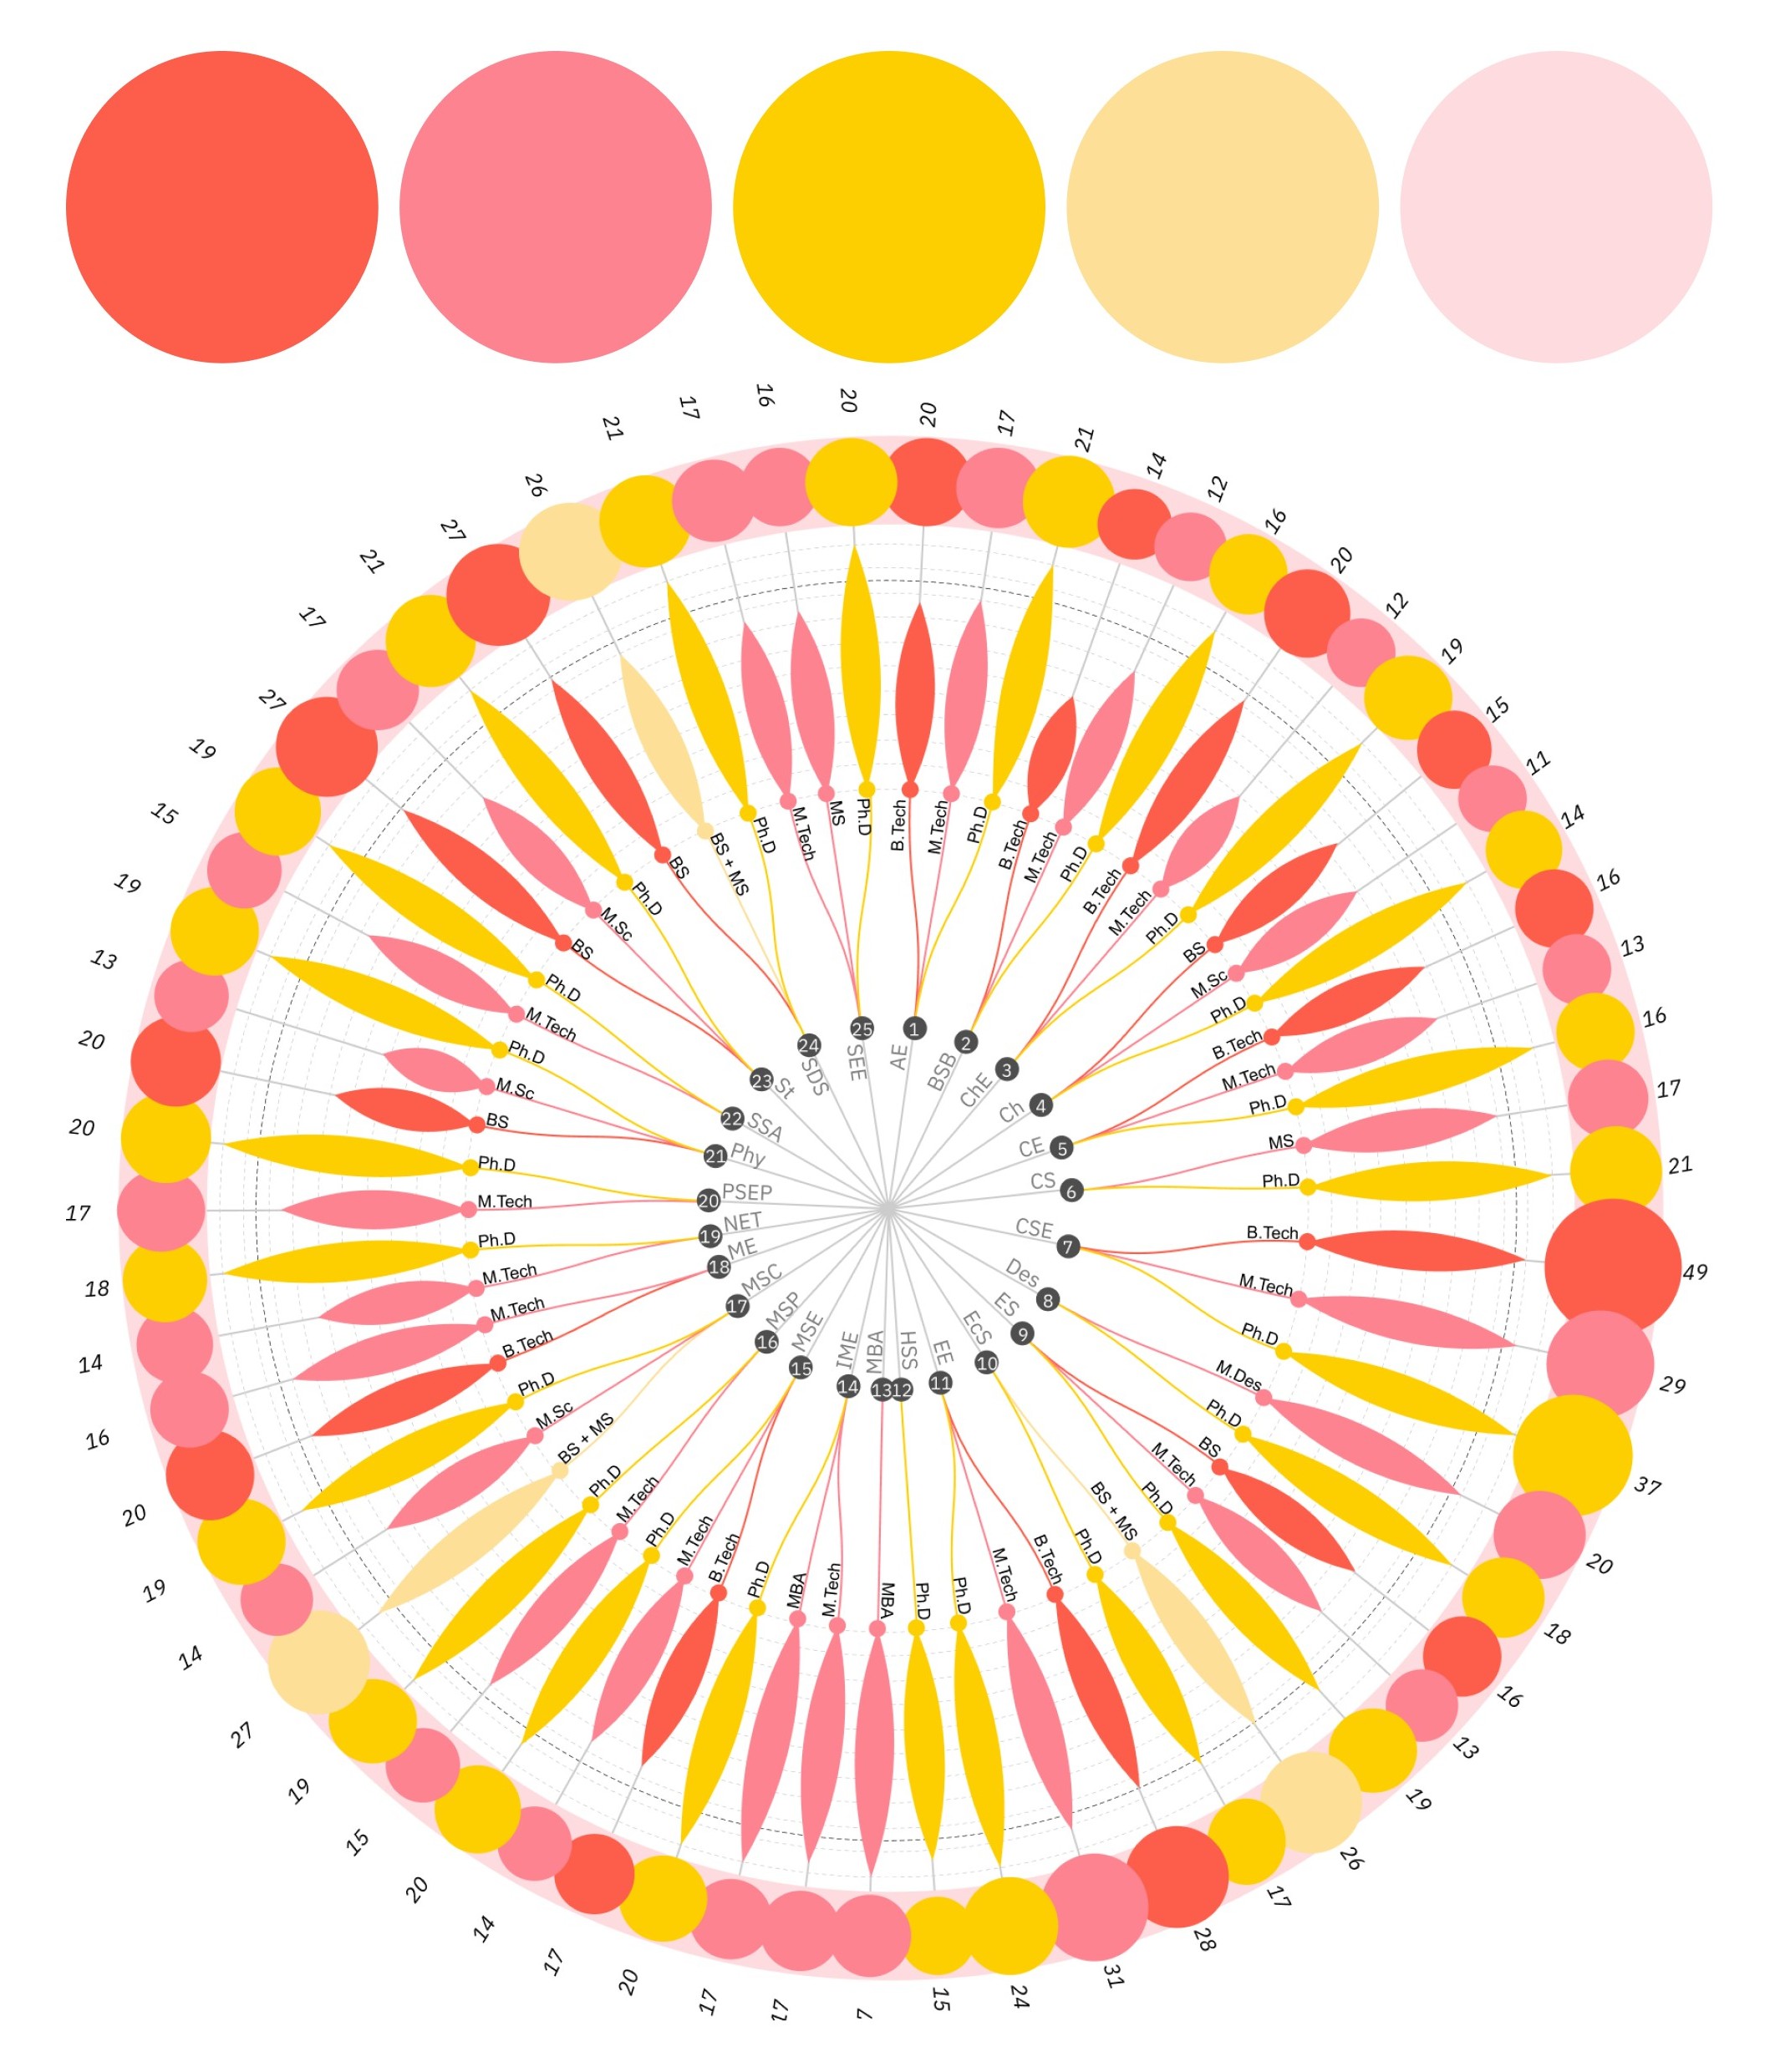
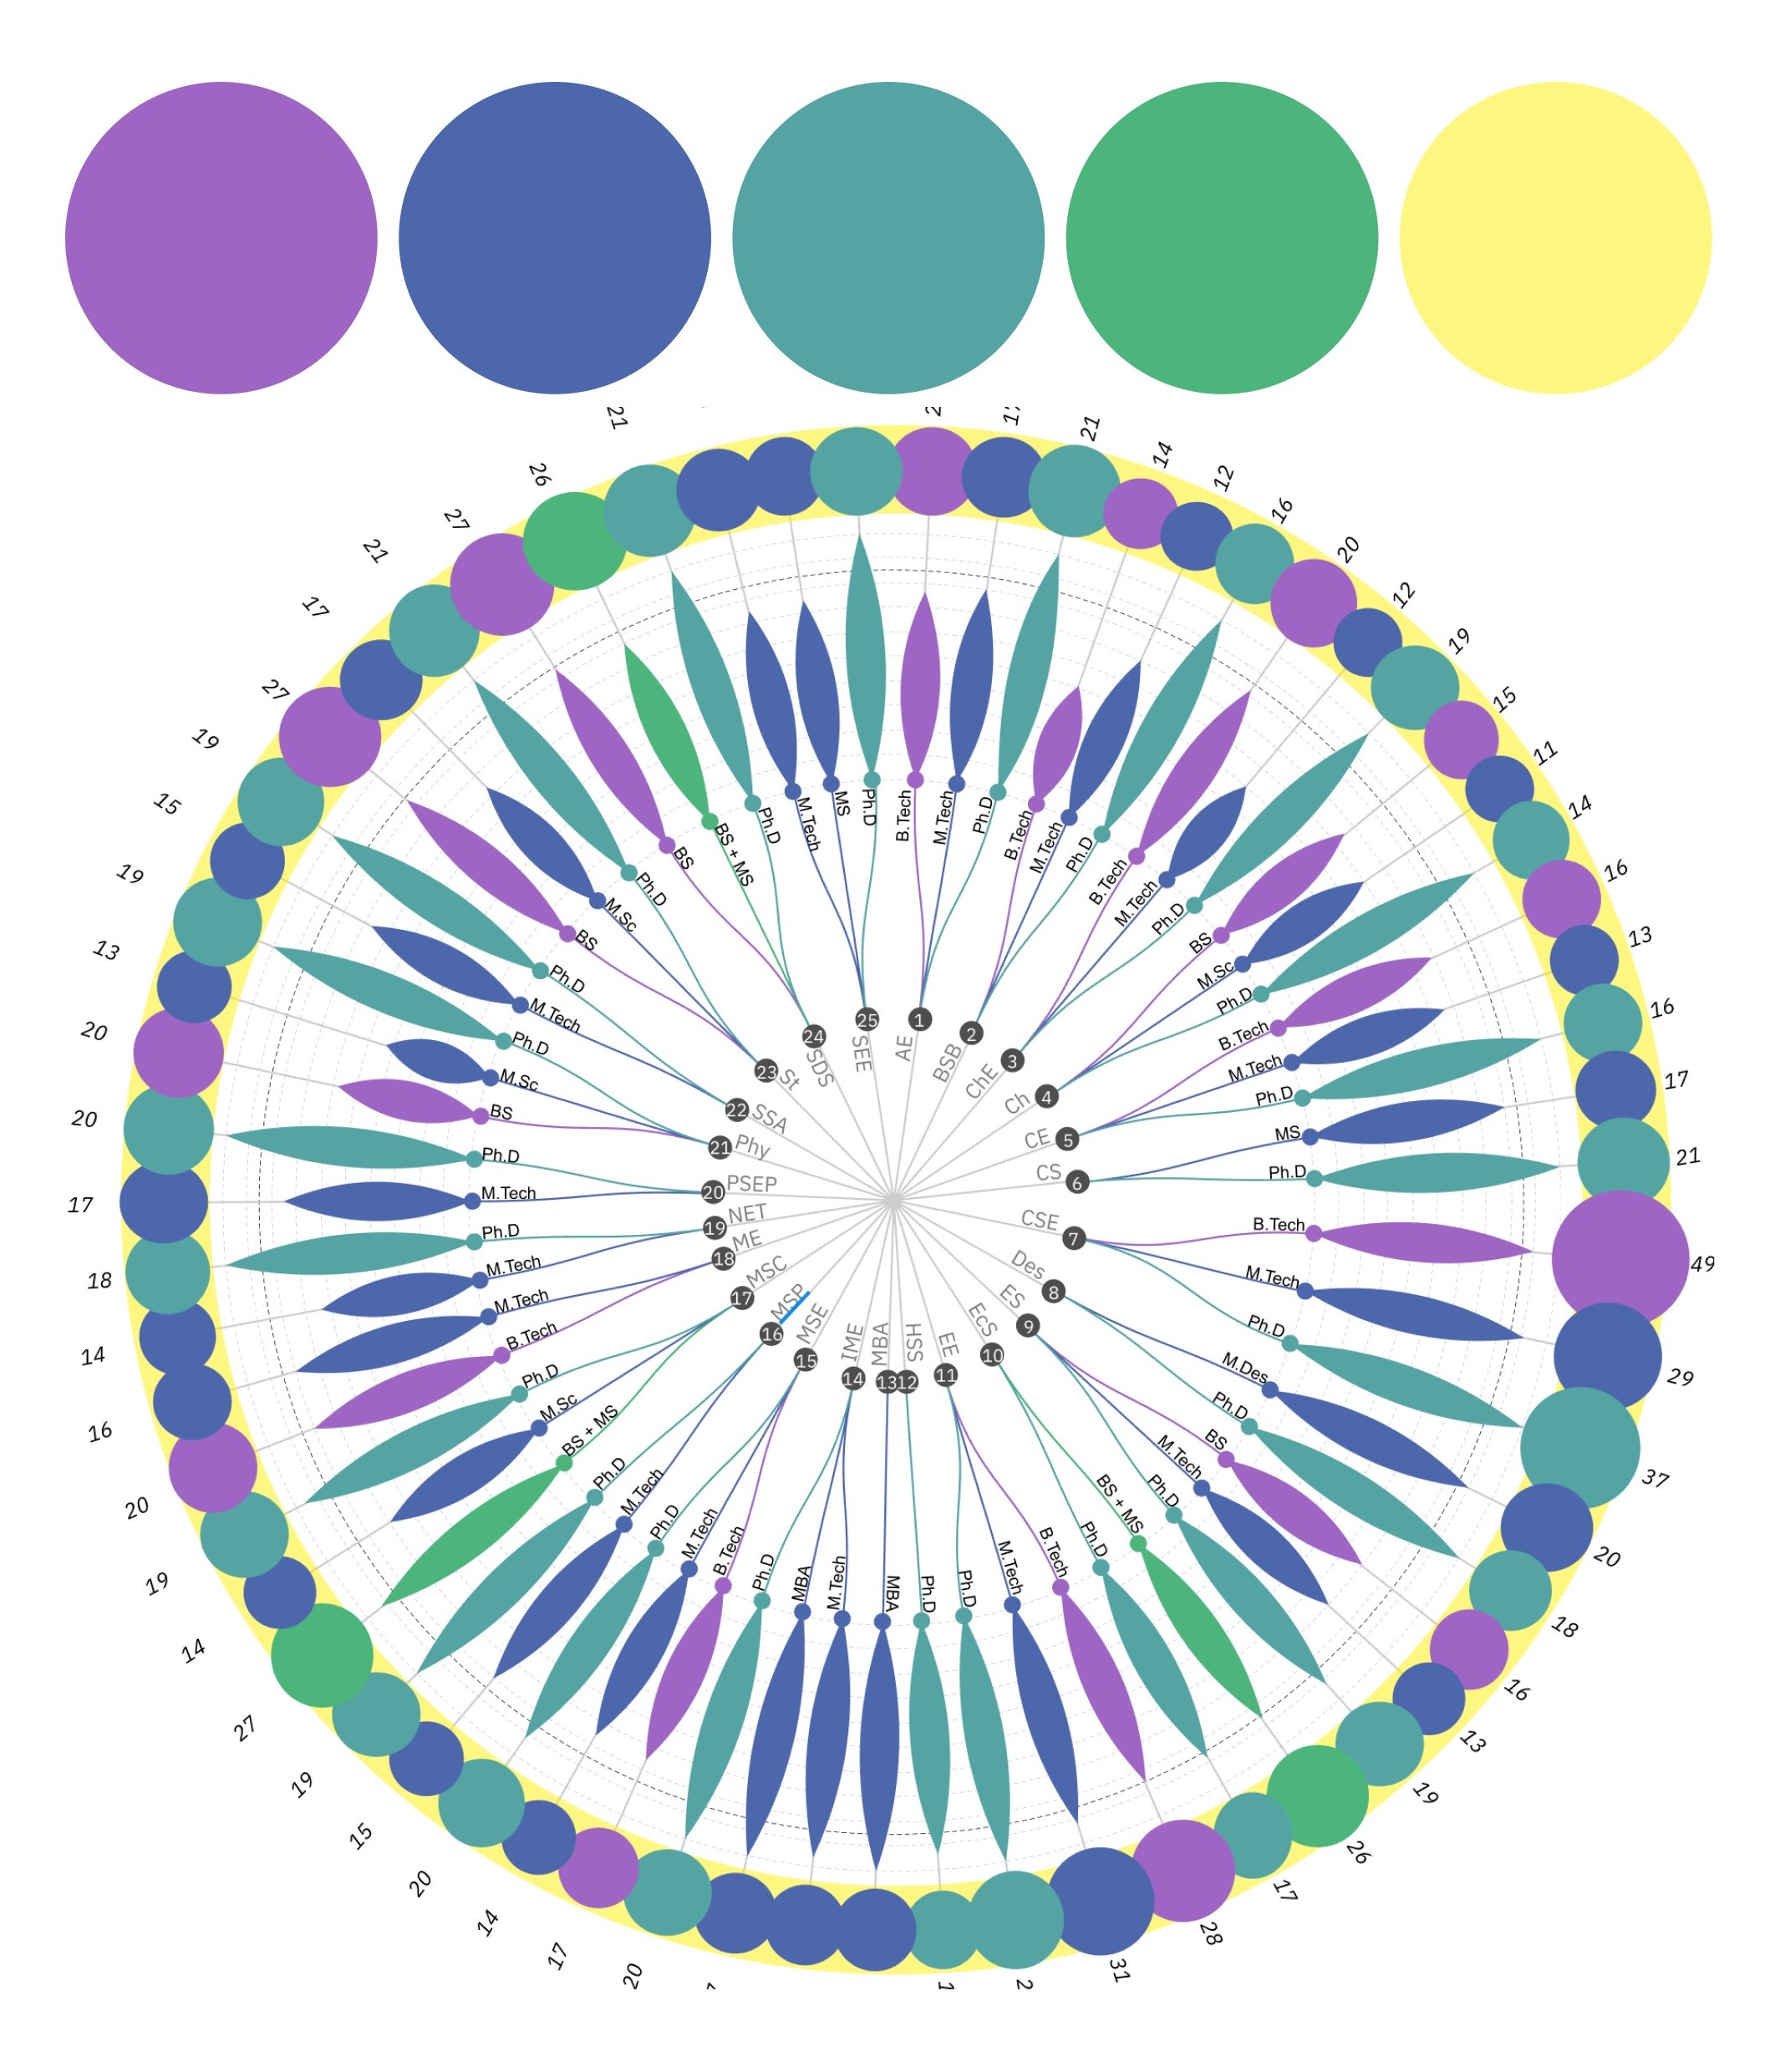
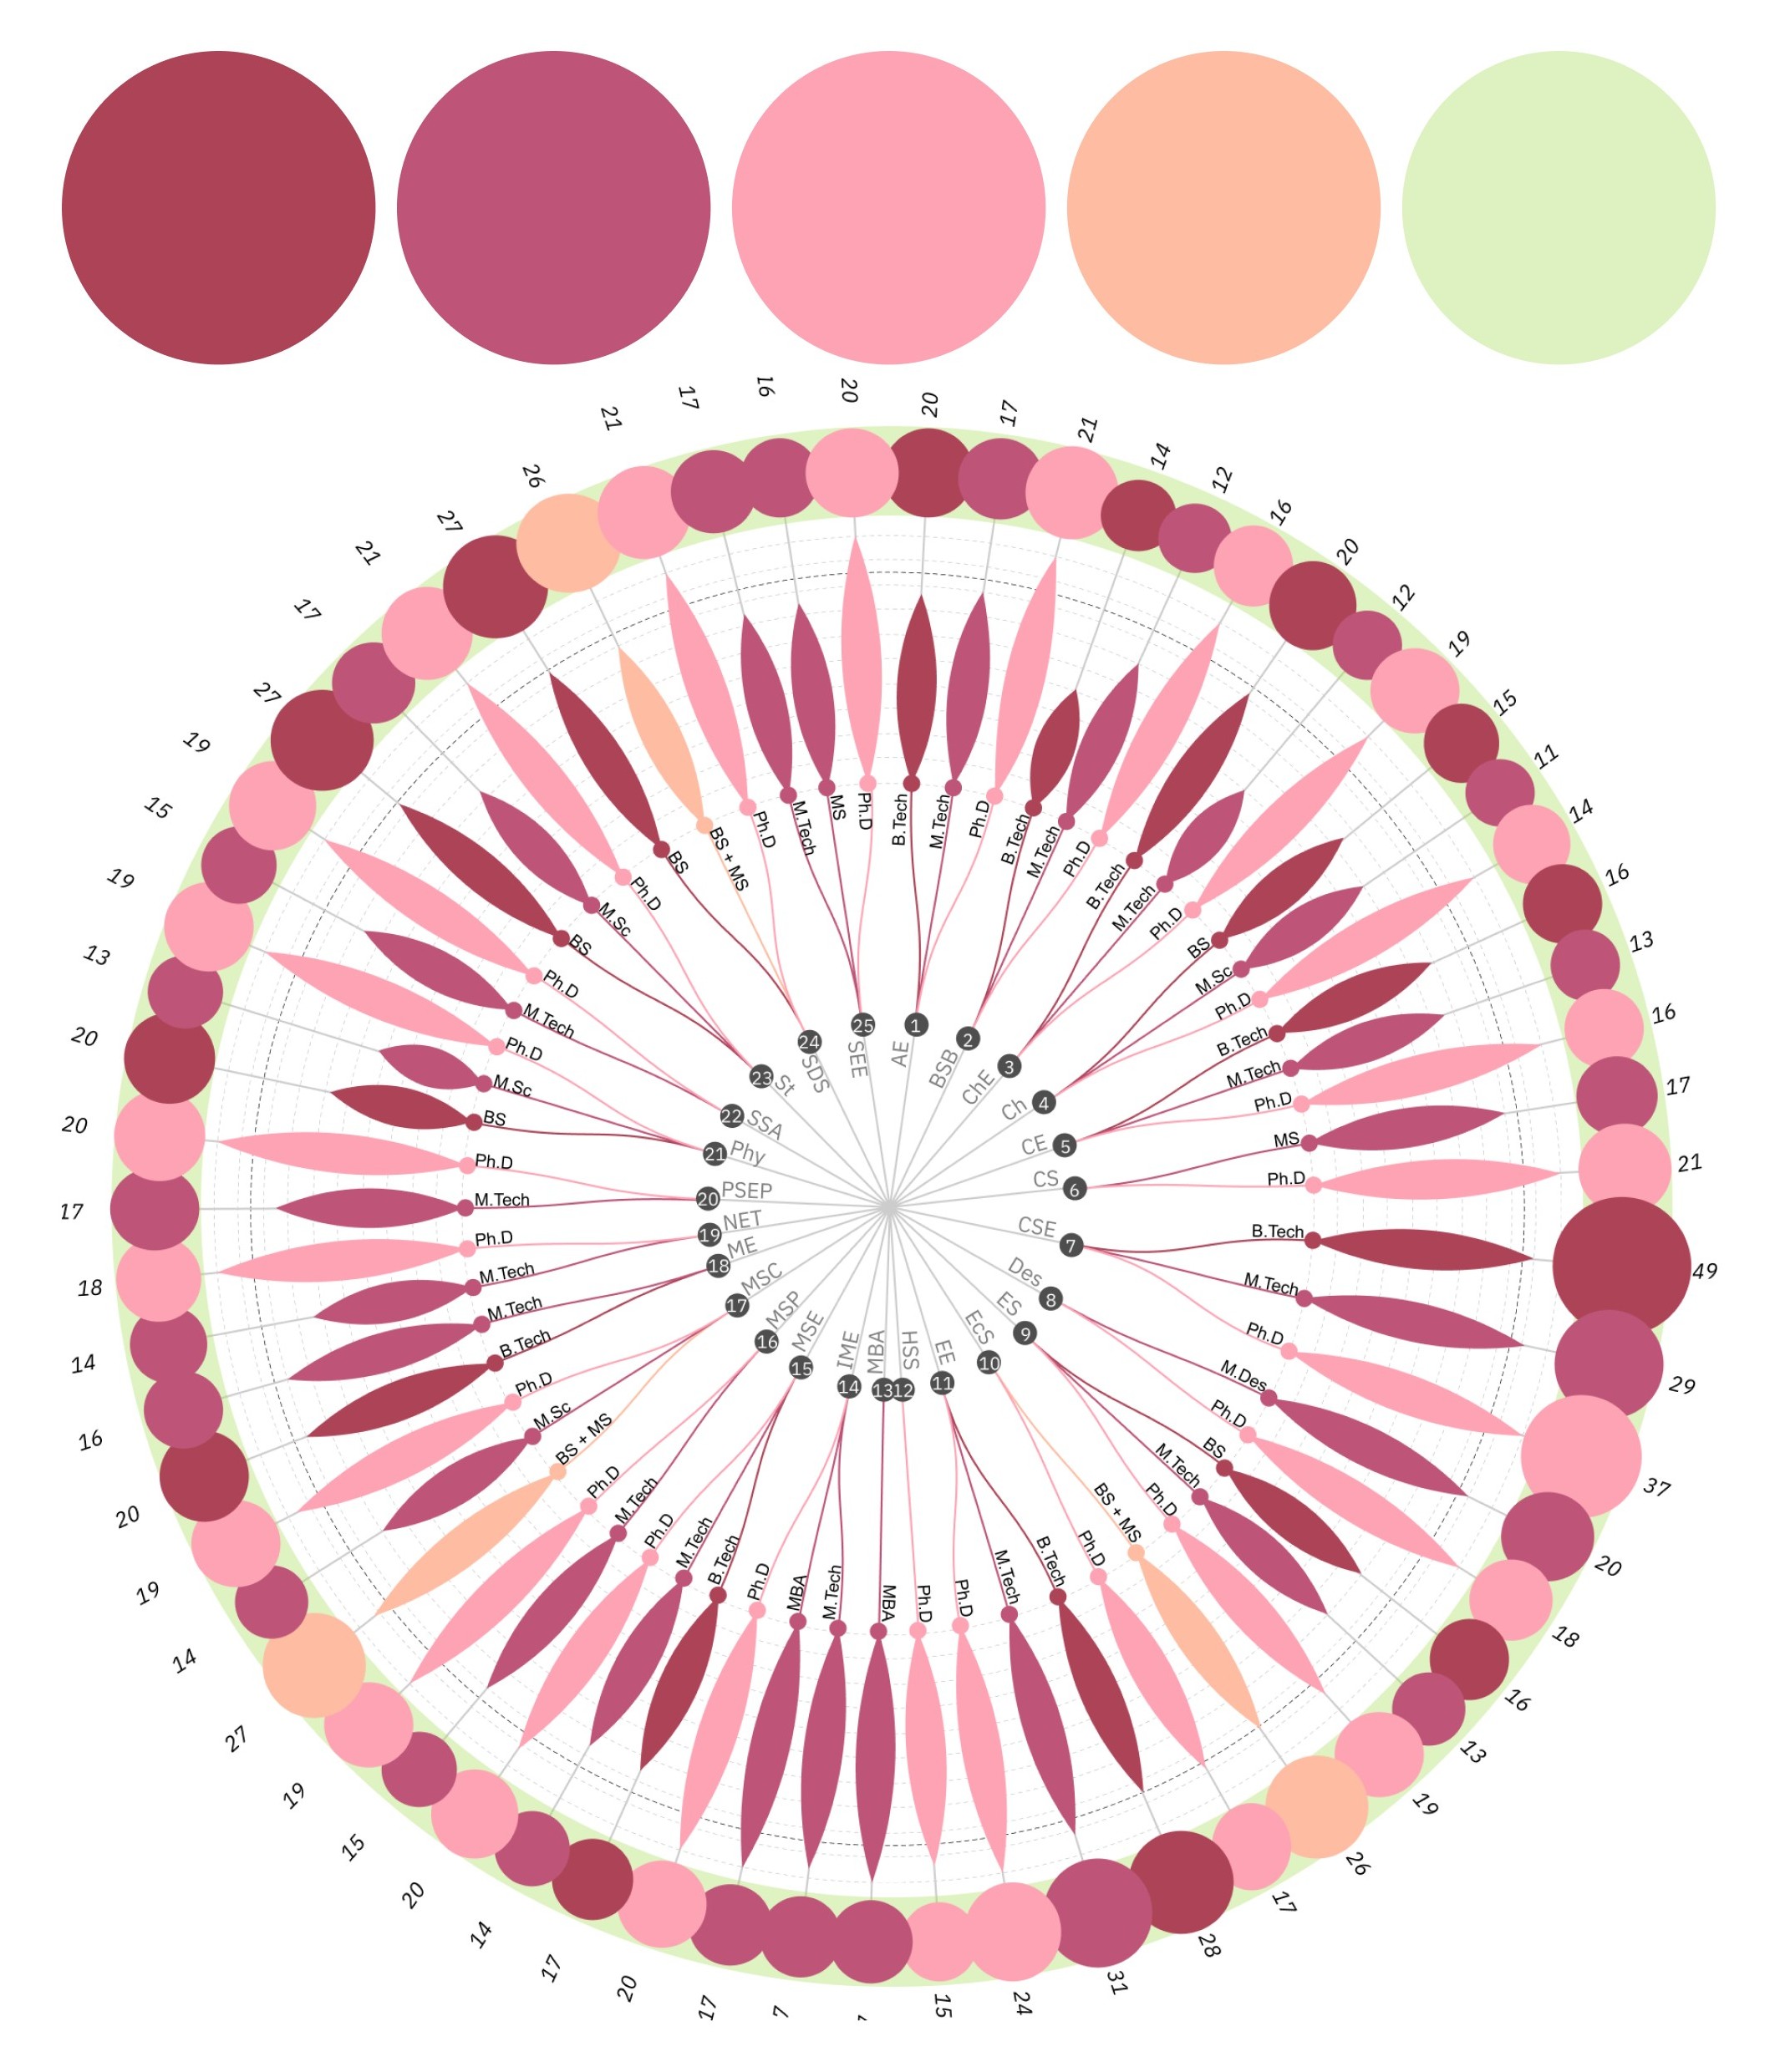
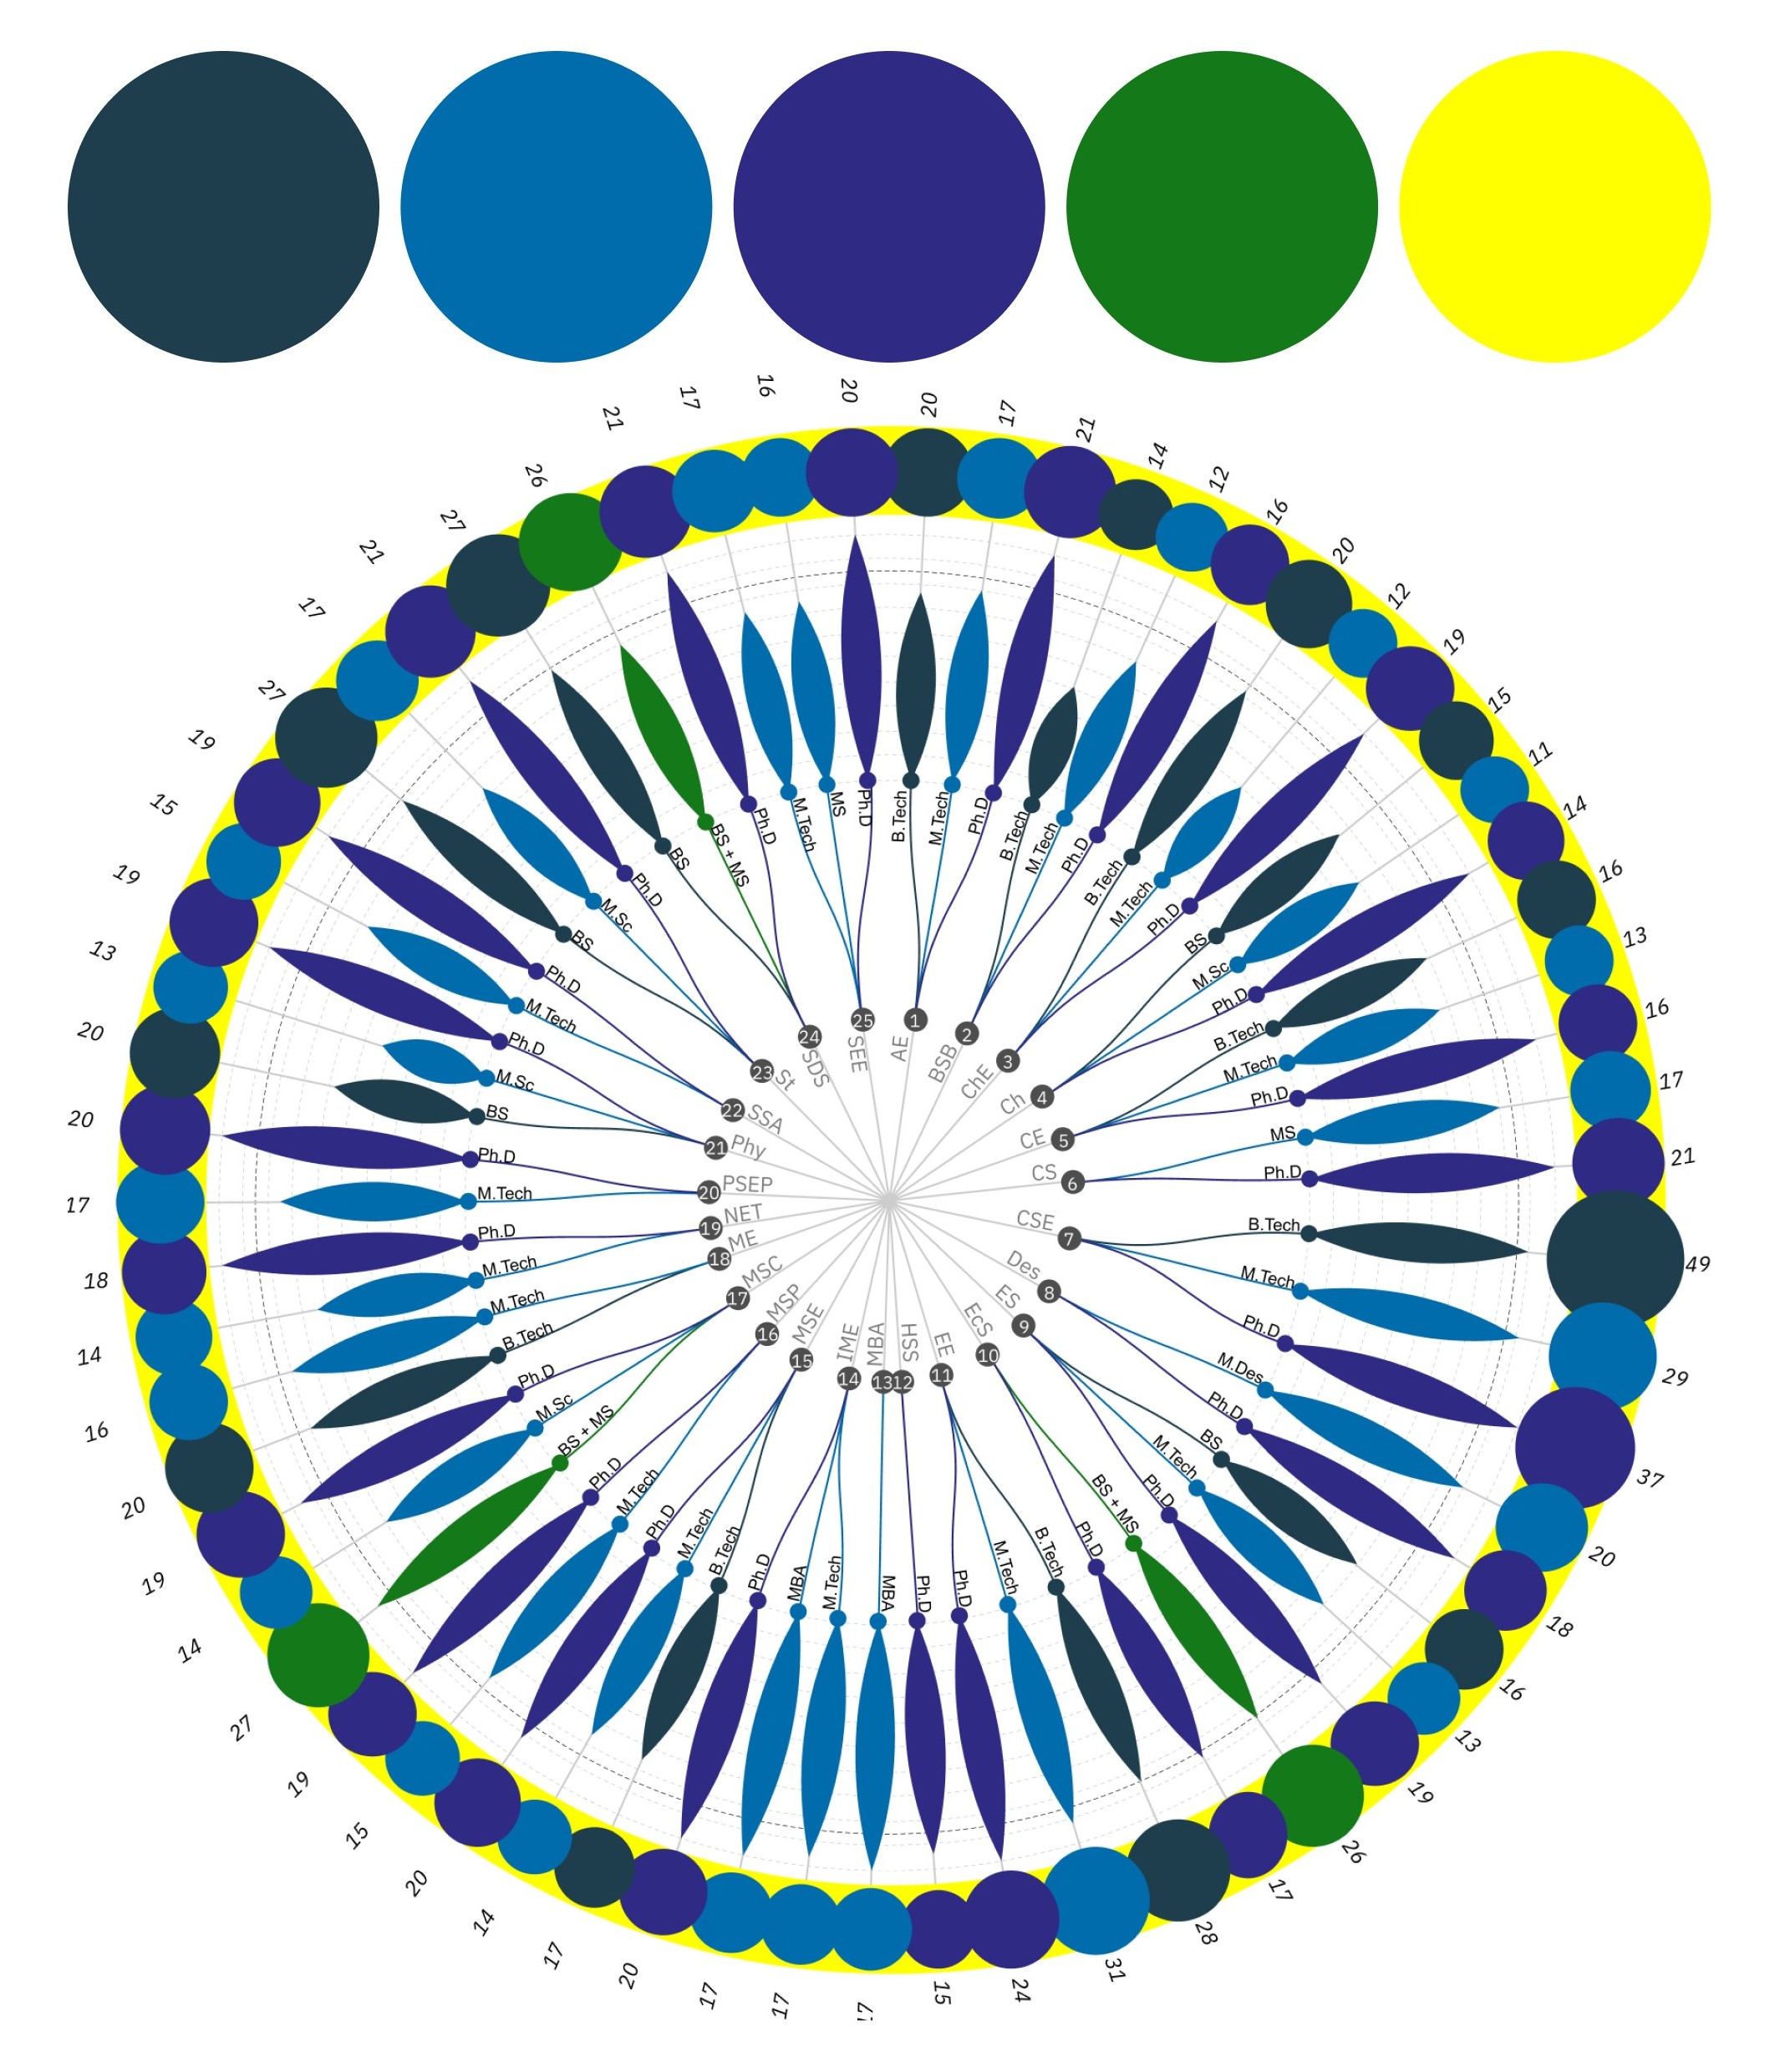
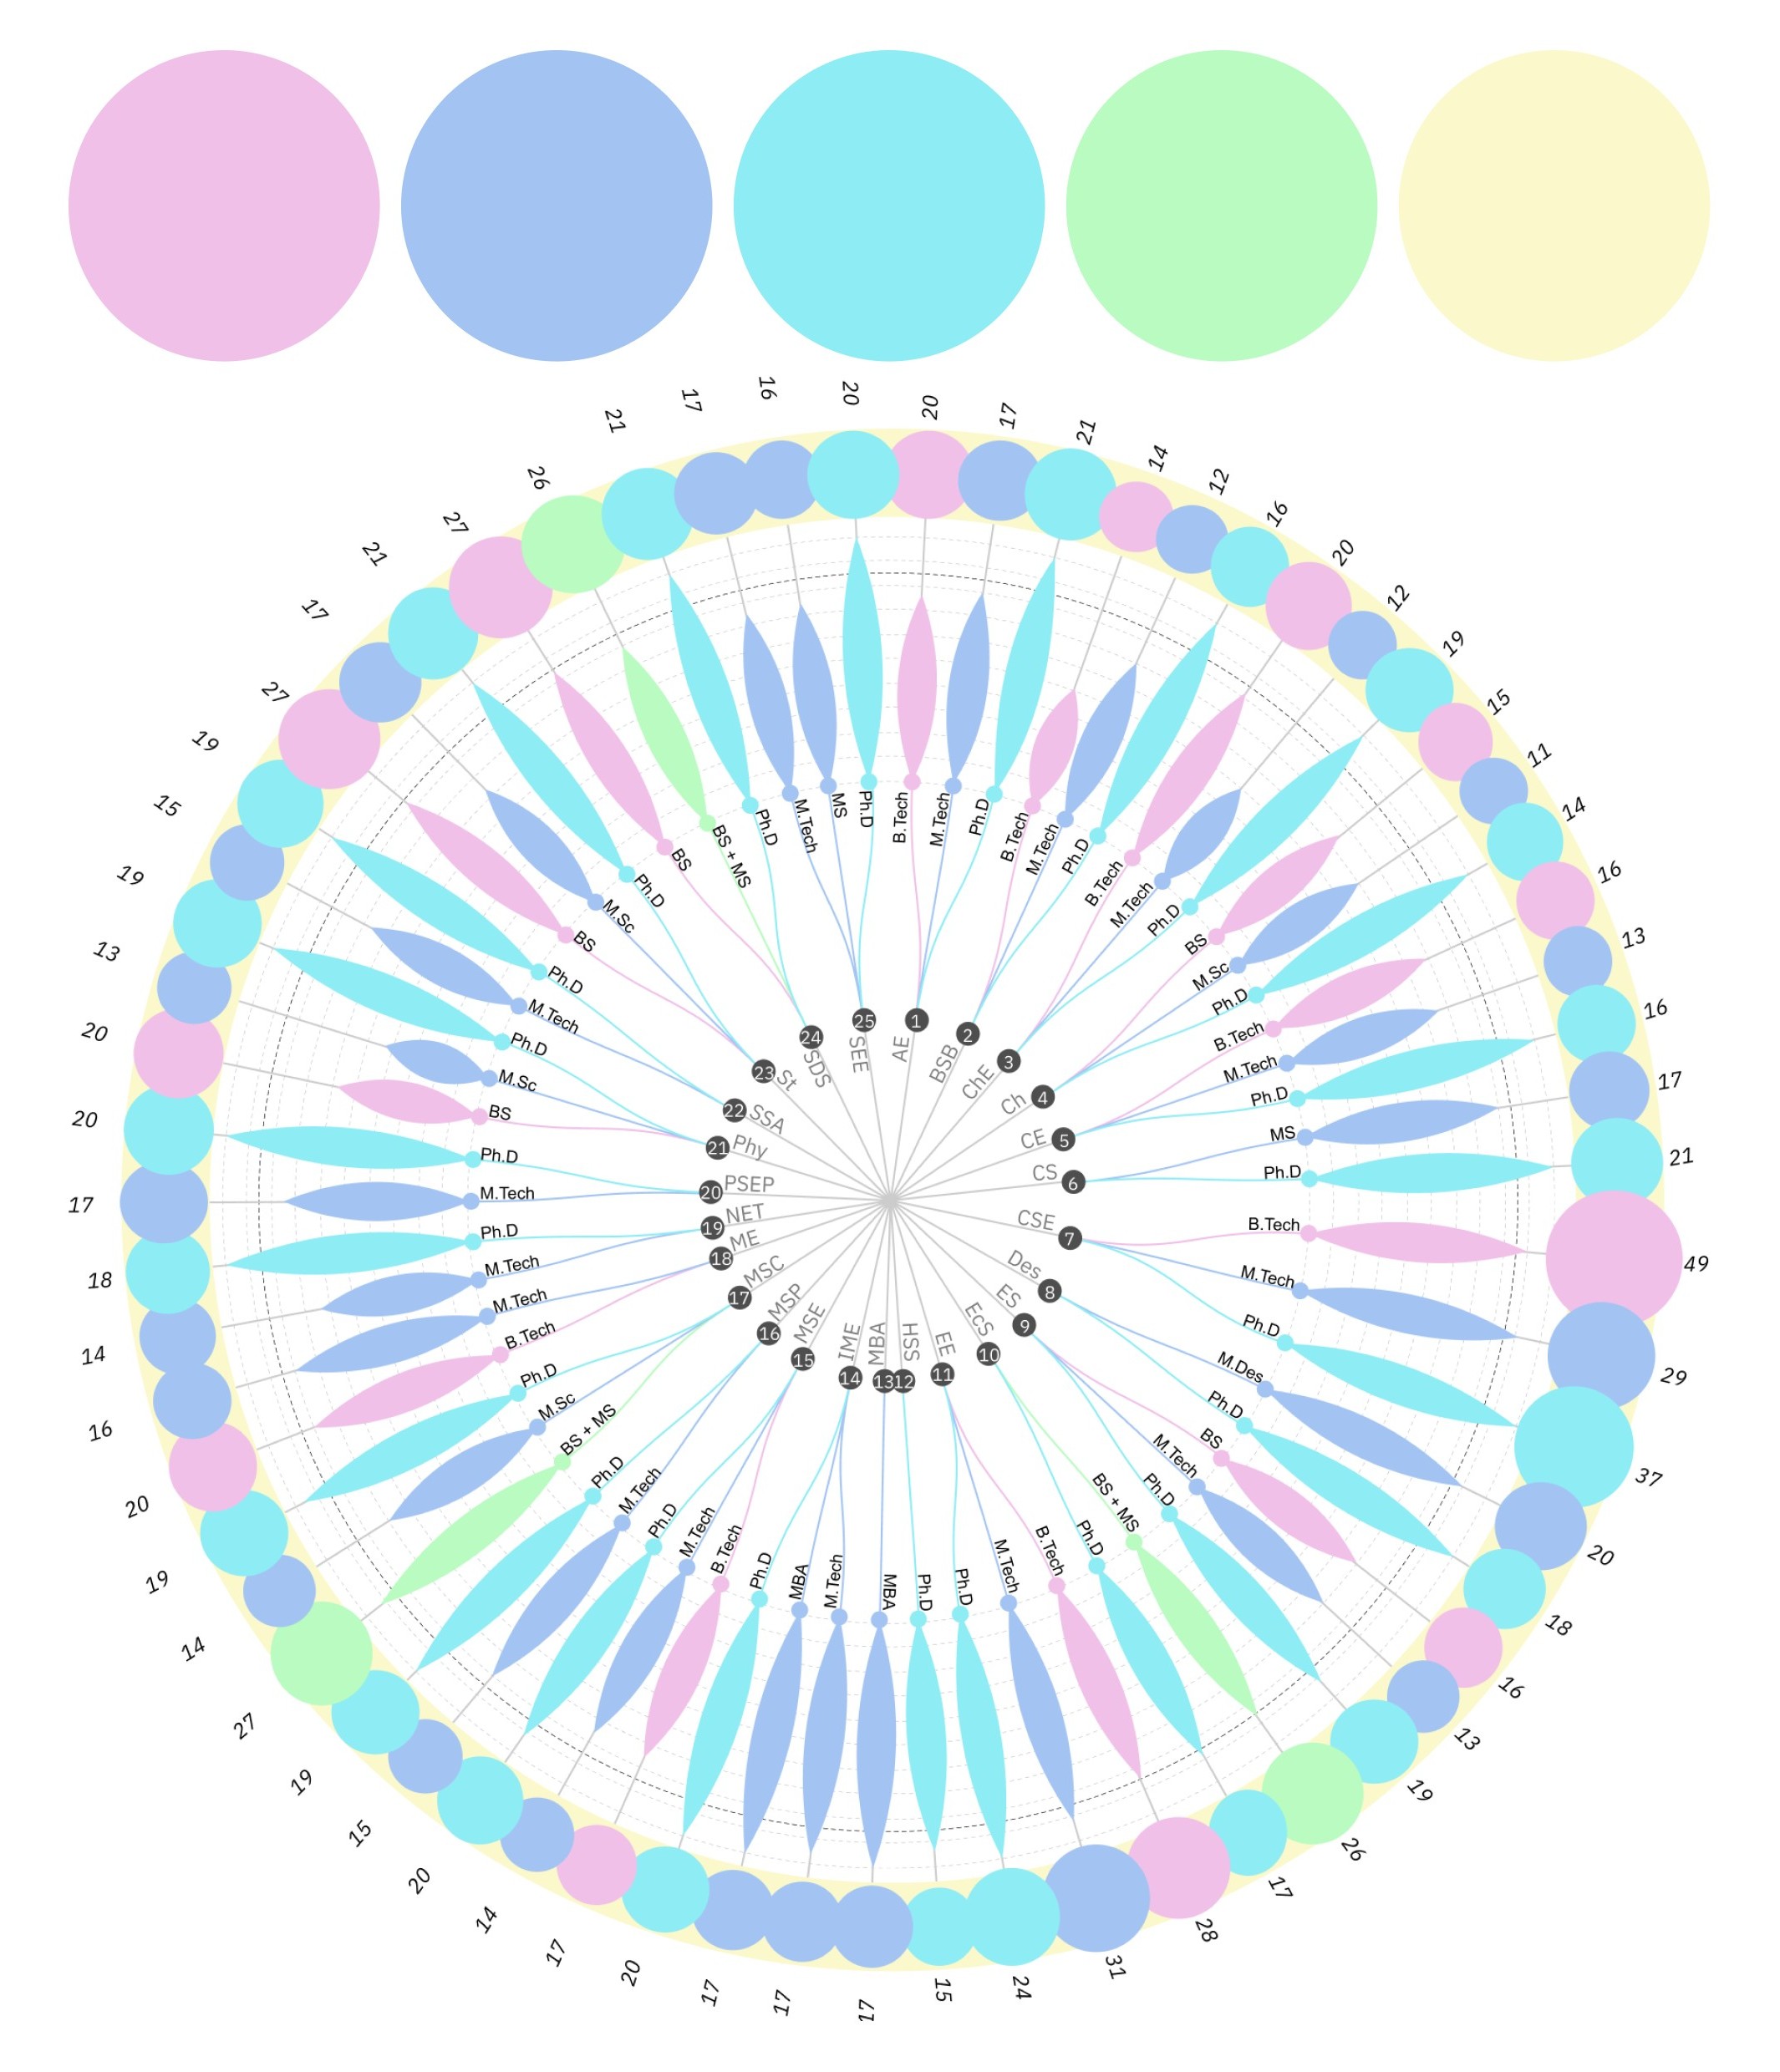
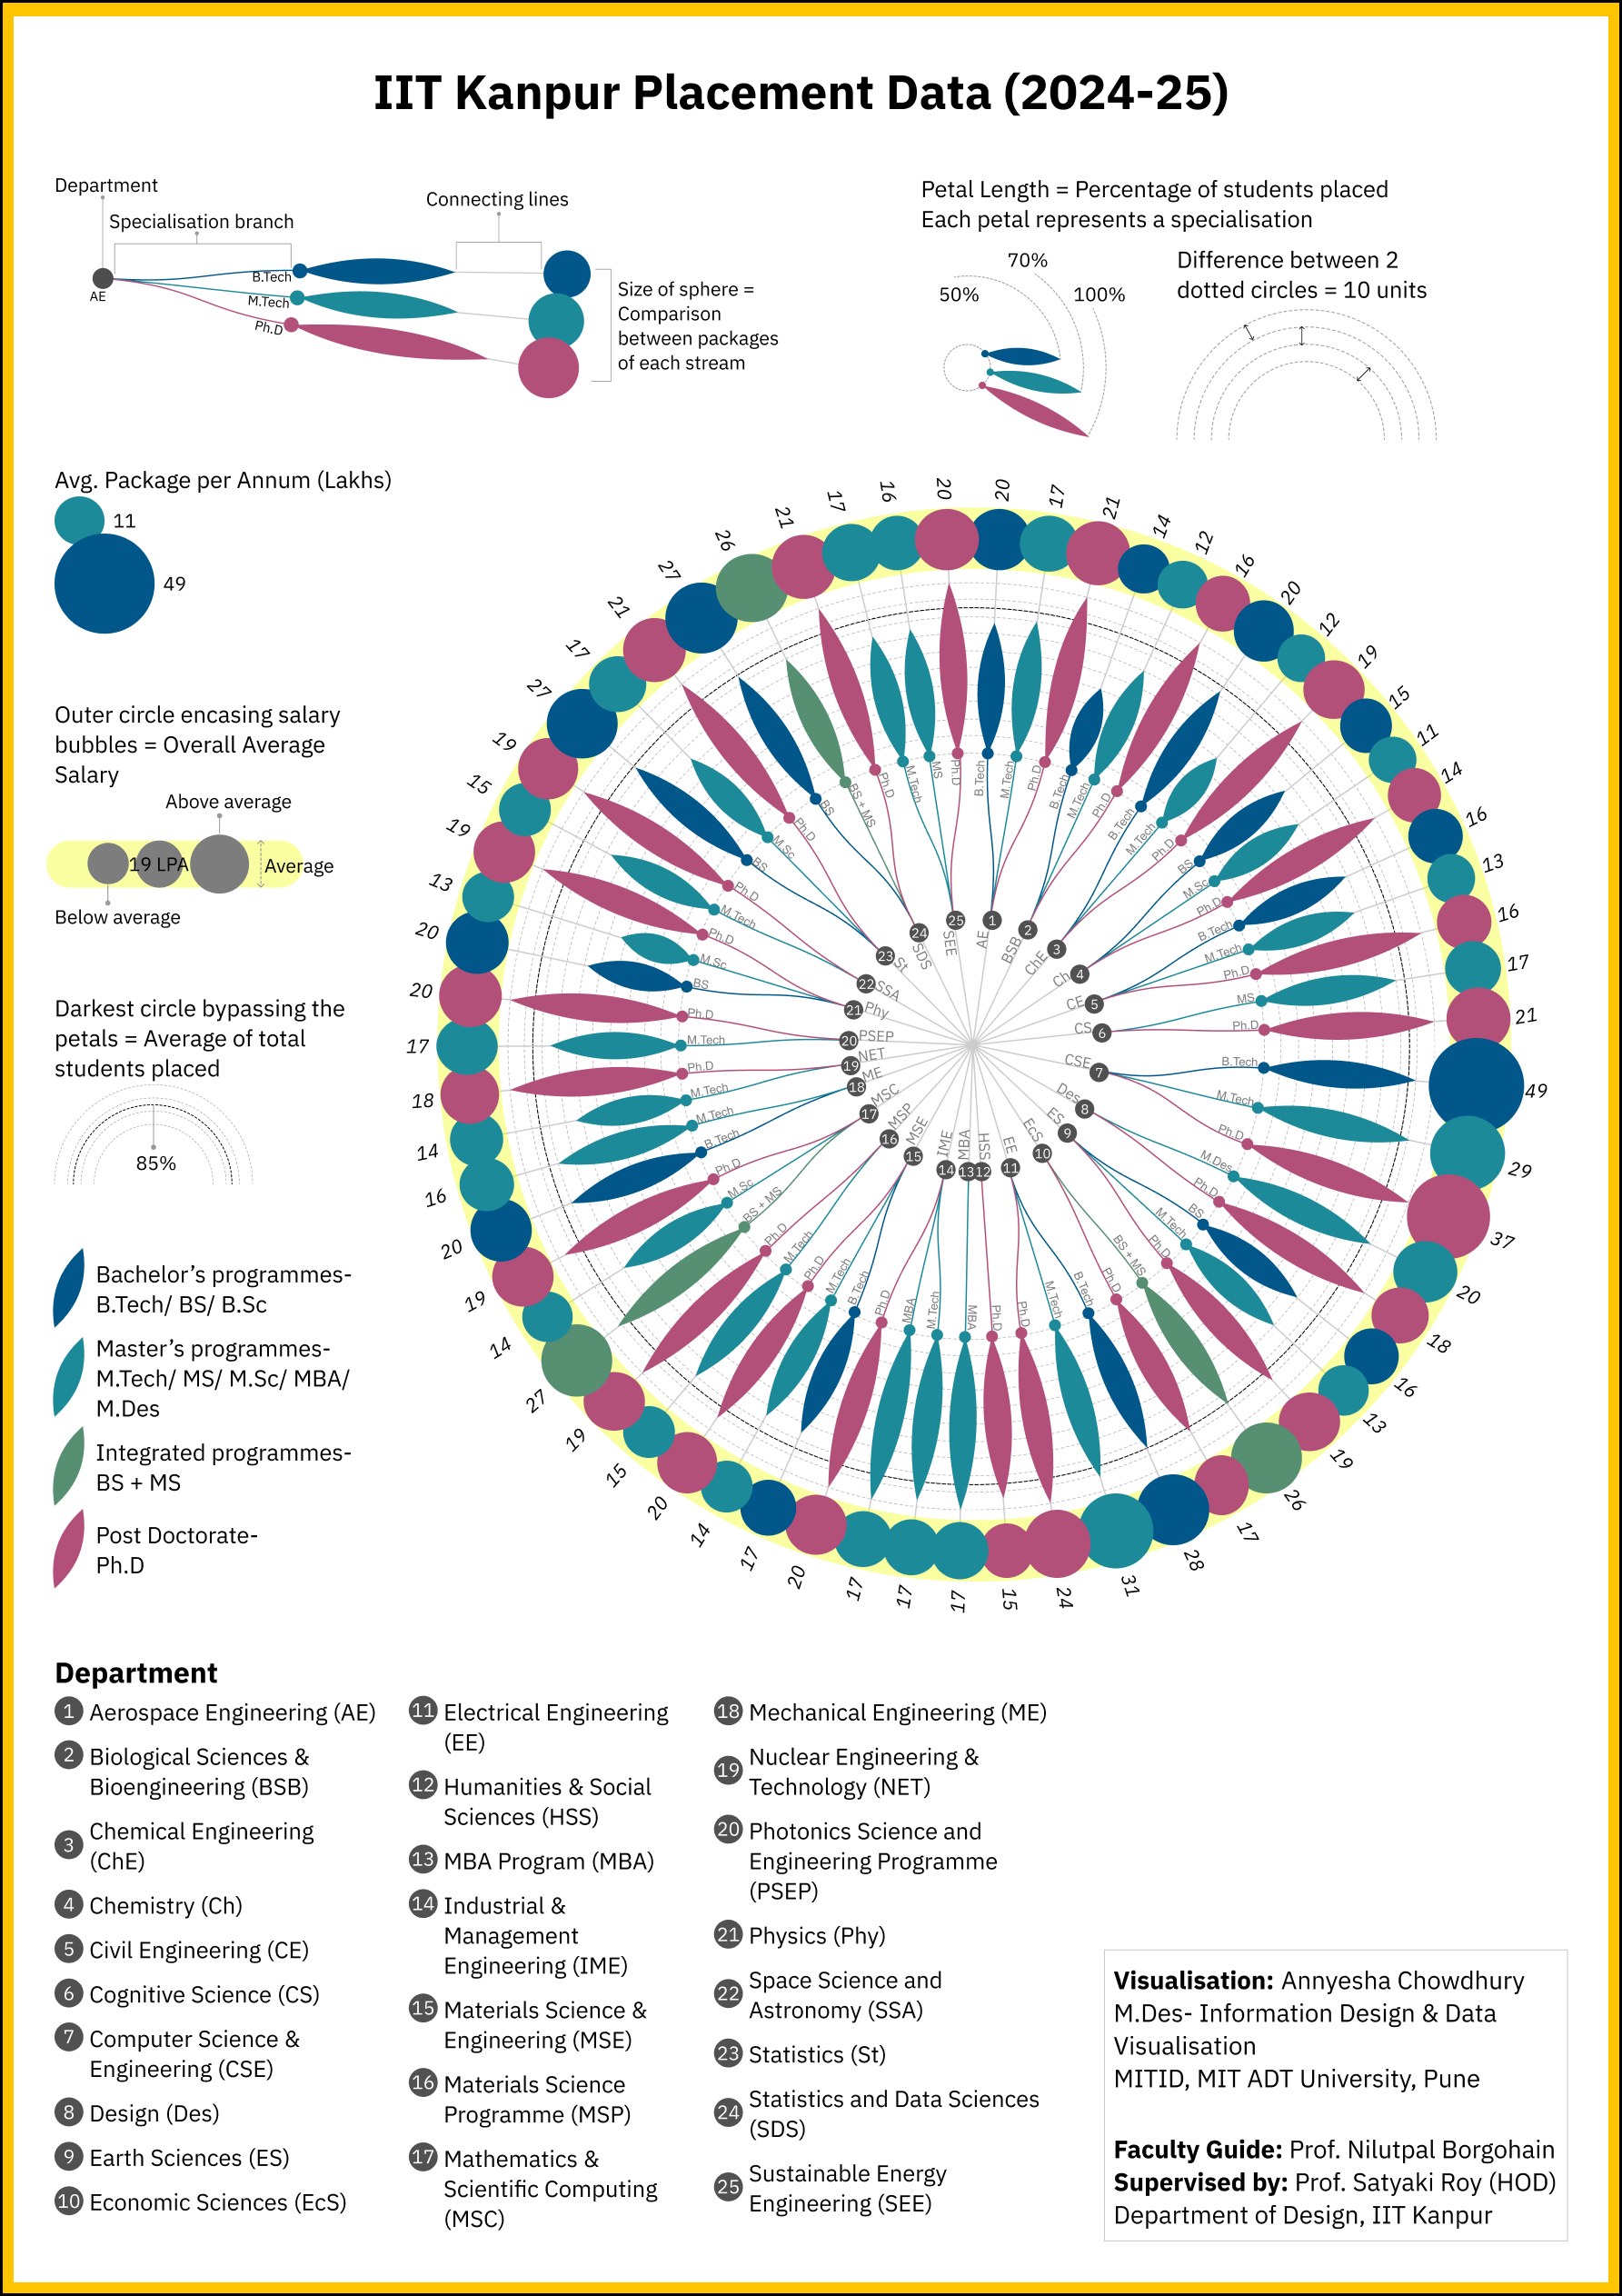
Before touching the placement dataset, I built a mood board of reference visualisations: radial taxonomies, sunburst hierarchies and category-coded circular charts, to understand how dense, multi-dimensional data could be organised around a single centre. The peacock feather was expressive, but ultimately too illustrative for a walk-up public interface, and was set aside in favour of a more legible radial structure.