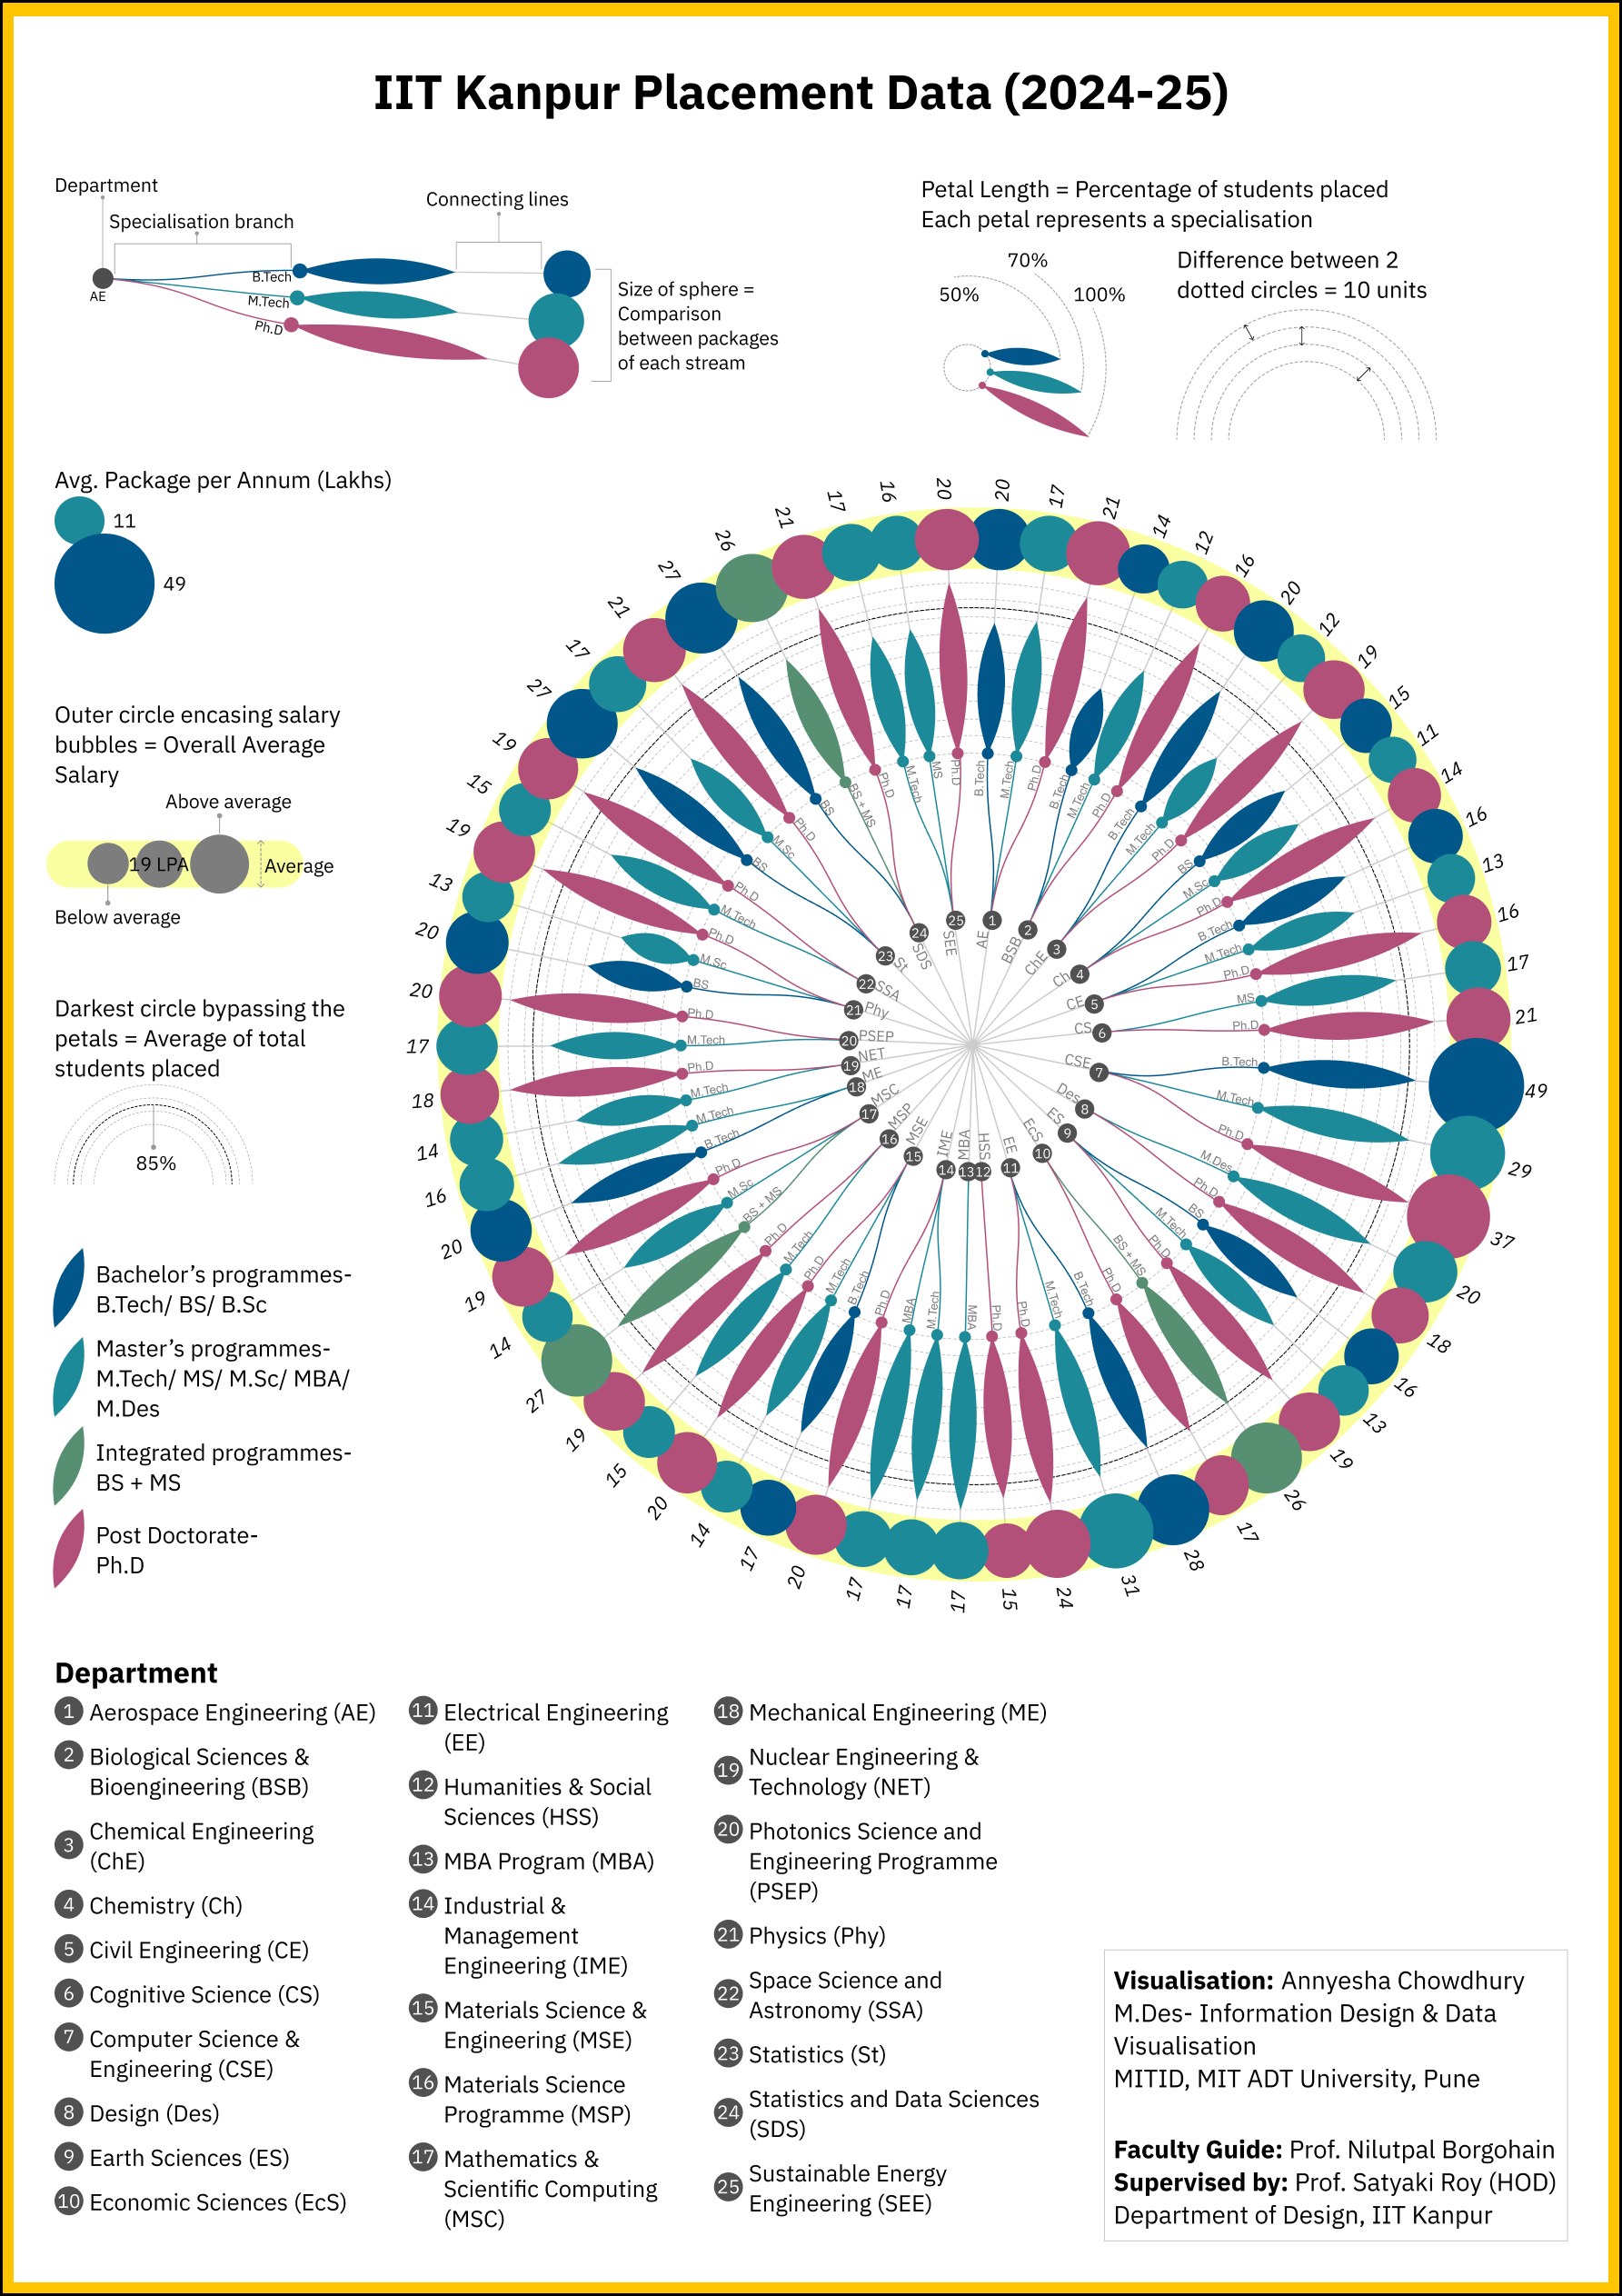
IIT Kanpur placement data, 2024–25.

Twenty-five departments, every specialisation, one radial chart a visitor can read without a single table.

Radial data visualisation artwork: magenta-to-blue bars radiating from the centre, each ending in a pin
0Departments & programmes mapped
0Average placement rate
0Highest average package
01 / The brief

A walk-up display for the Director’s Lounge.

As a Data Visualization Intern in the Department of Design, I designed a base visualisation system for the dynamic, interactive data interface of the Director’s Lounge, part of IIT Kanpur’s public showcase of institutional data. The interface turns dense institutional datasets into a walk-up-and-use experience for visitors, prospective students and guests.

This was the third and most complex of three datasets. The goal: show placement outcomes for every department and programme at a glance, in a form that is readable from across a room and still rewards a closer look.

02 / Process

Three stages, from references to A1.

Stage 1 · Reference & concept exploration

Ideations & iterations

Before touching the placement dataset, I built a mood board of reference visualisations: radial taxonomies, sunburst hierarchies and category-coded circular charts, to understand how dense, multi-dimensional data could be organised around a single centre. The peacock feather was expressive, but ultimately too illustrative for a walk-up public interface, and was set aside in favour of a more legible radial structure.
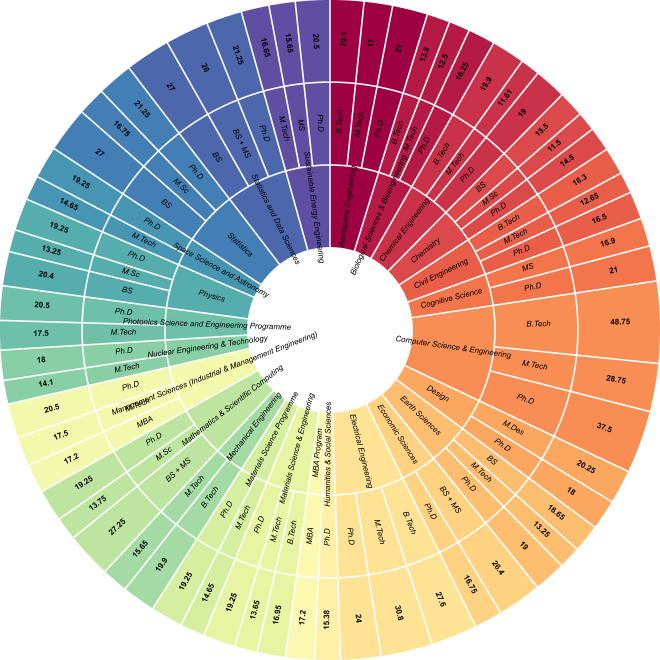
Sunburst study of departments, specialisations and package values
Sunburst hierarchy
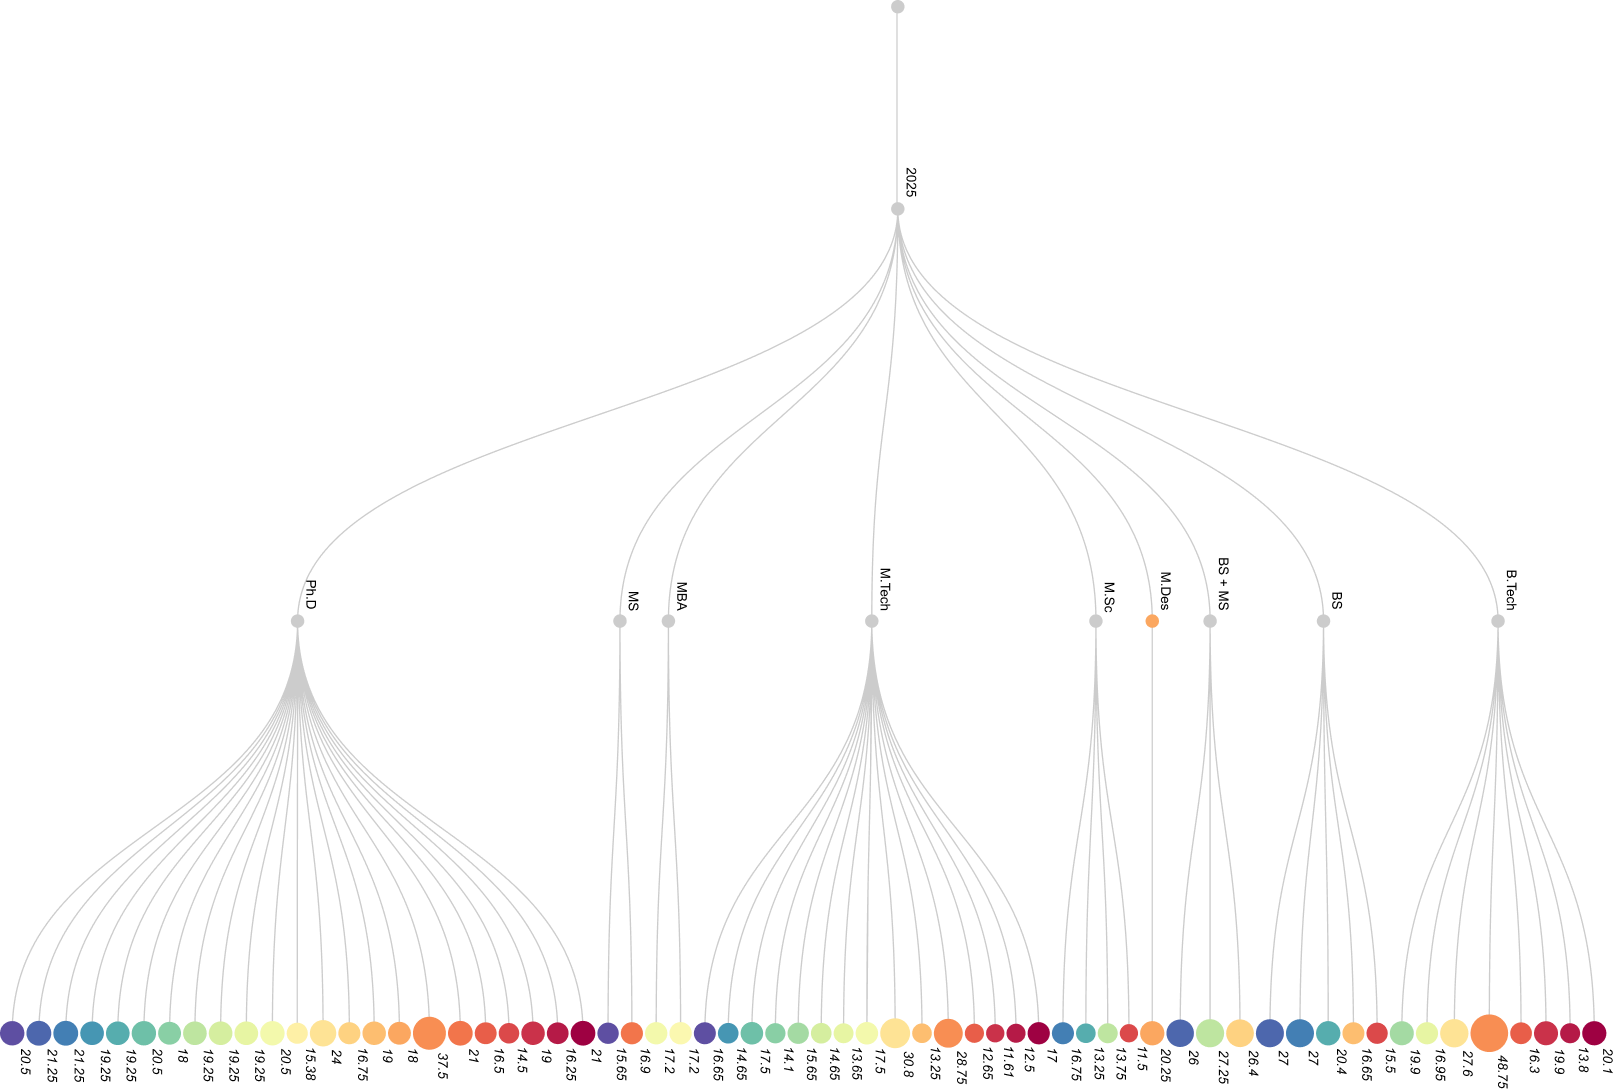
Tree layout linking the year, programme types and individual package spheres
Tree: year to programme to package
Stage 2 · Structuring the dataset

The data

With the visual language narrowed to a radial structure, the next stage was making the dataset usable. The raw data spanned 25 departments across four programme tiers (UG, PG, dual degree, PhD), each with specialisation-level placement percentages, inconsistent in formatting and needing to be cleaned, standardised and re-grouped by school before any chart could be built.

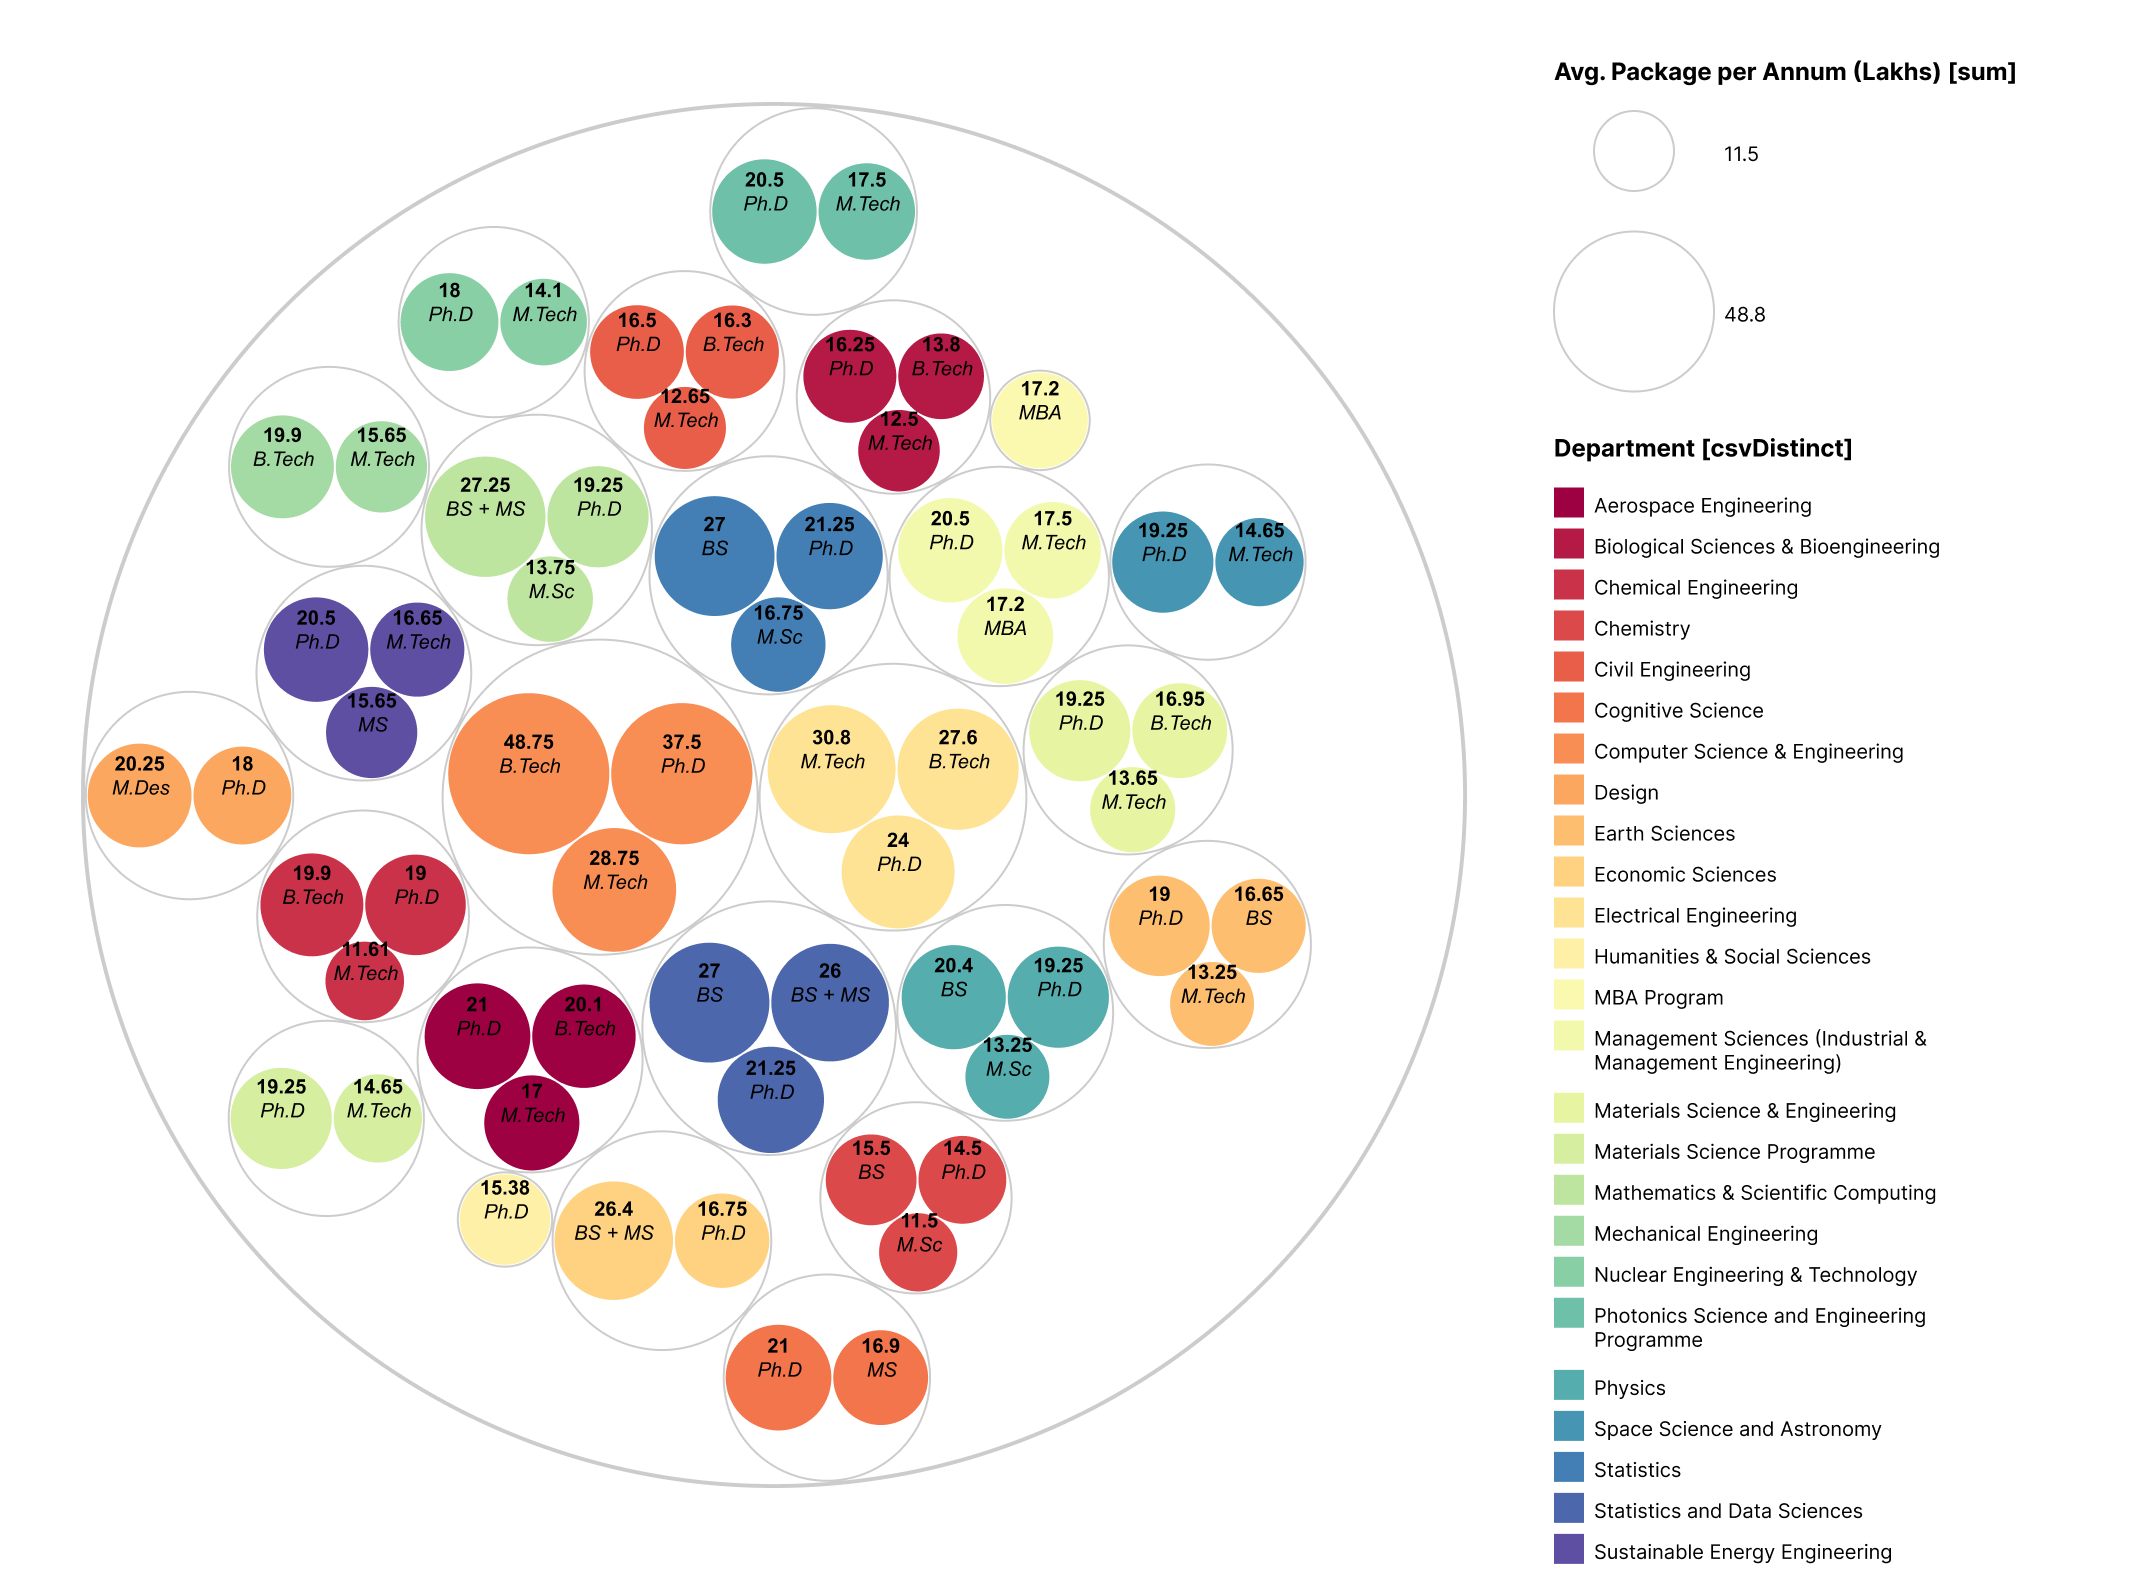
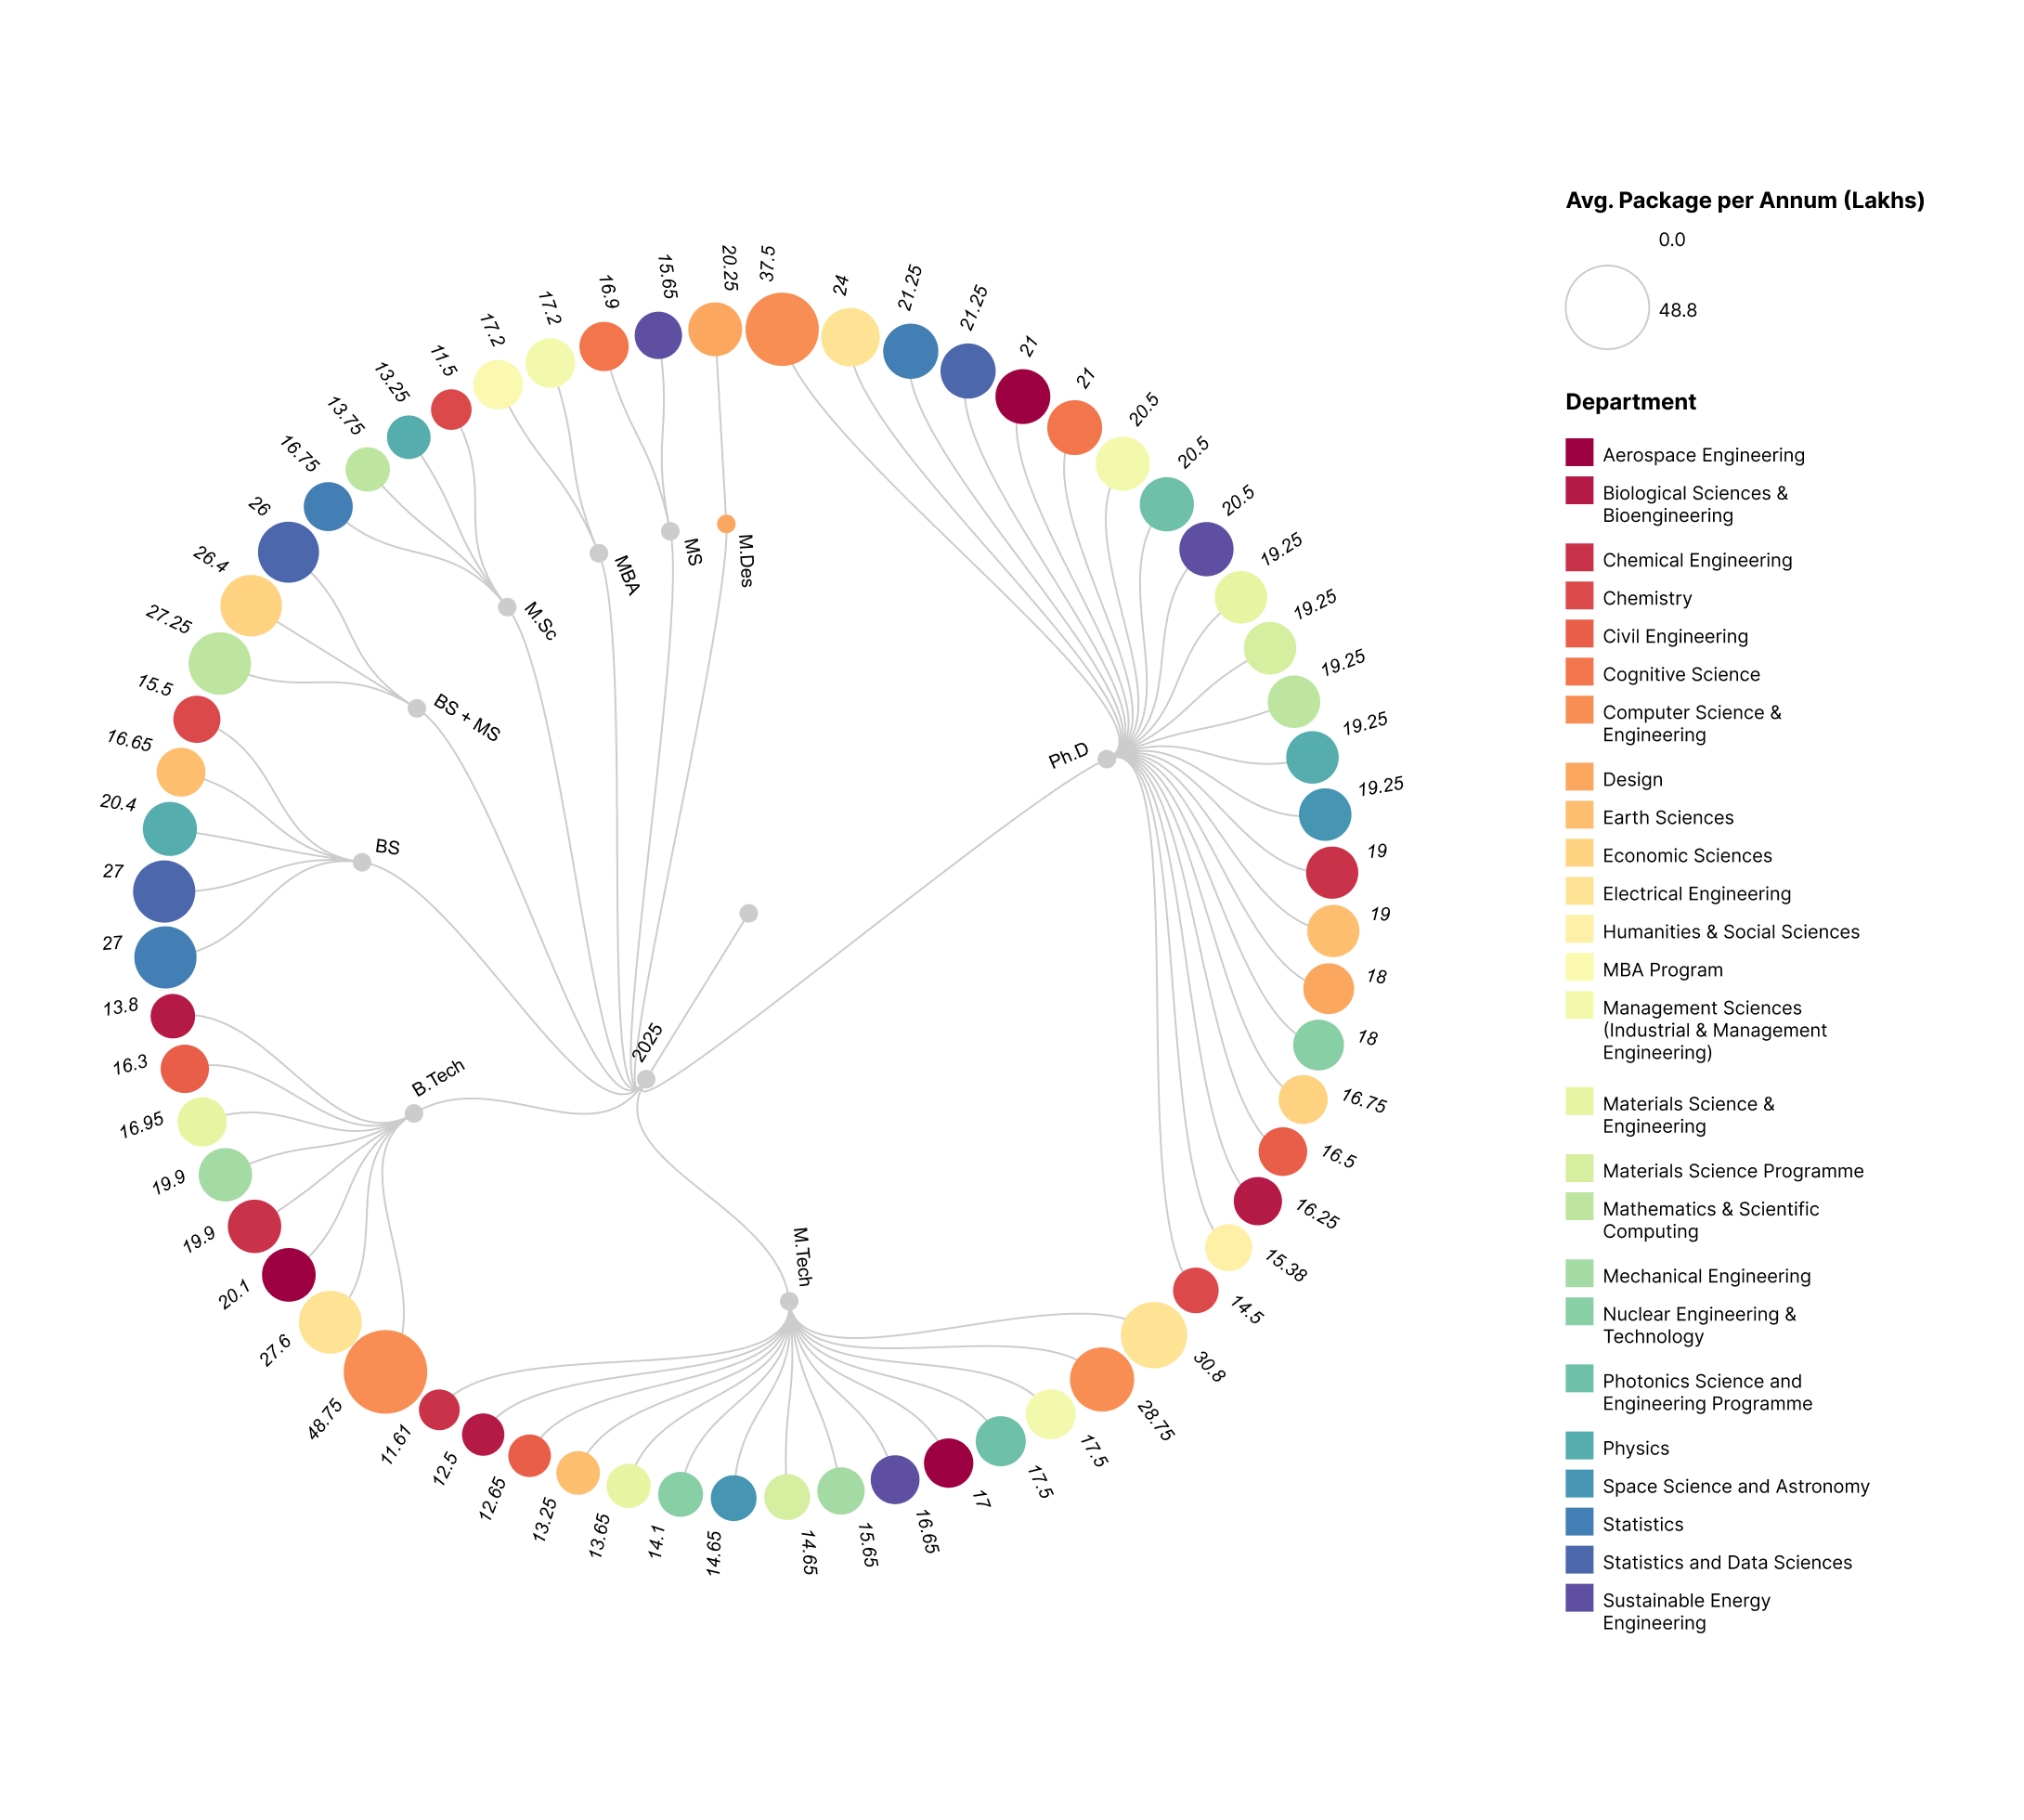
In parallel I iterated through circle-packing layouts and linear and circular dendrograms. The circular dendrograms carried the hierarchy clearly but lost readability at the leaf level, which shaped the final design decision.

Circle-packing layout of specialisations grouped by department
Circle packing
Circular dendrogram of programme types and package spheres
Circular dendrogram
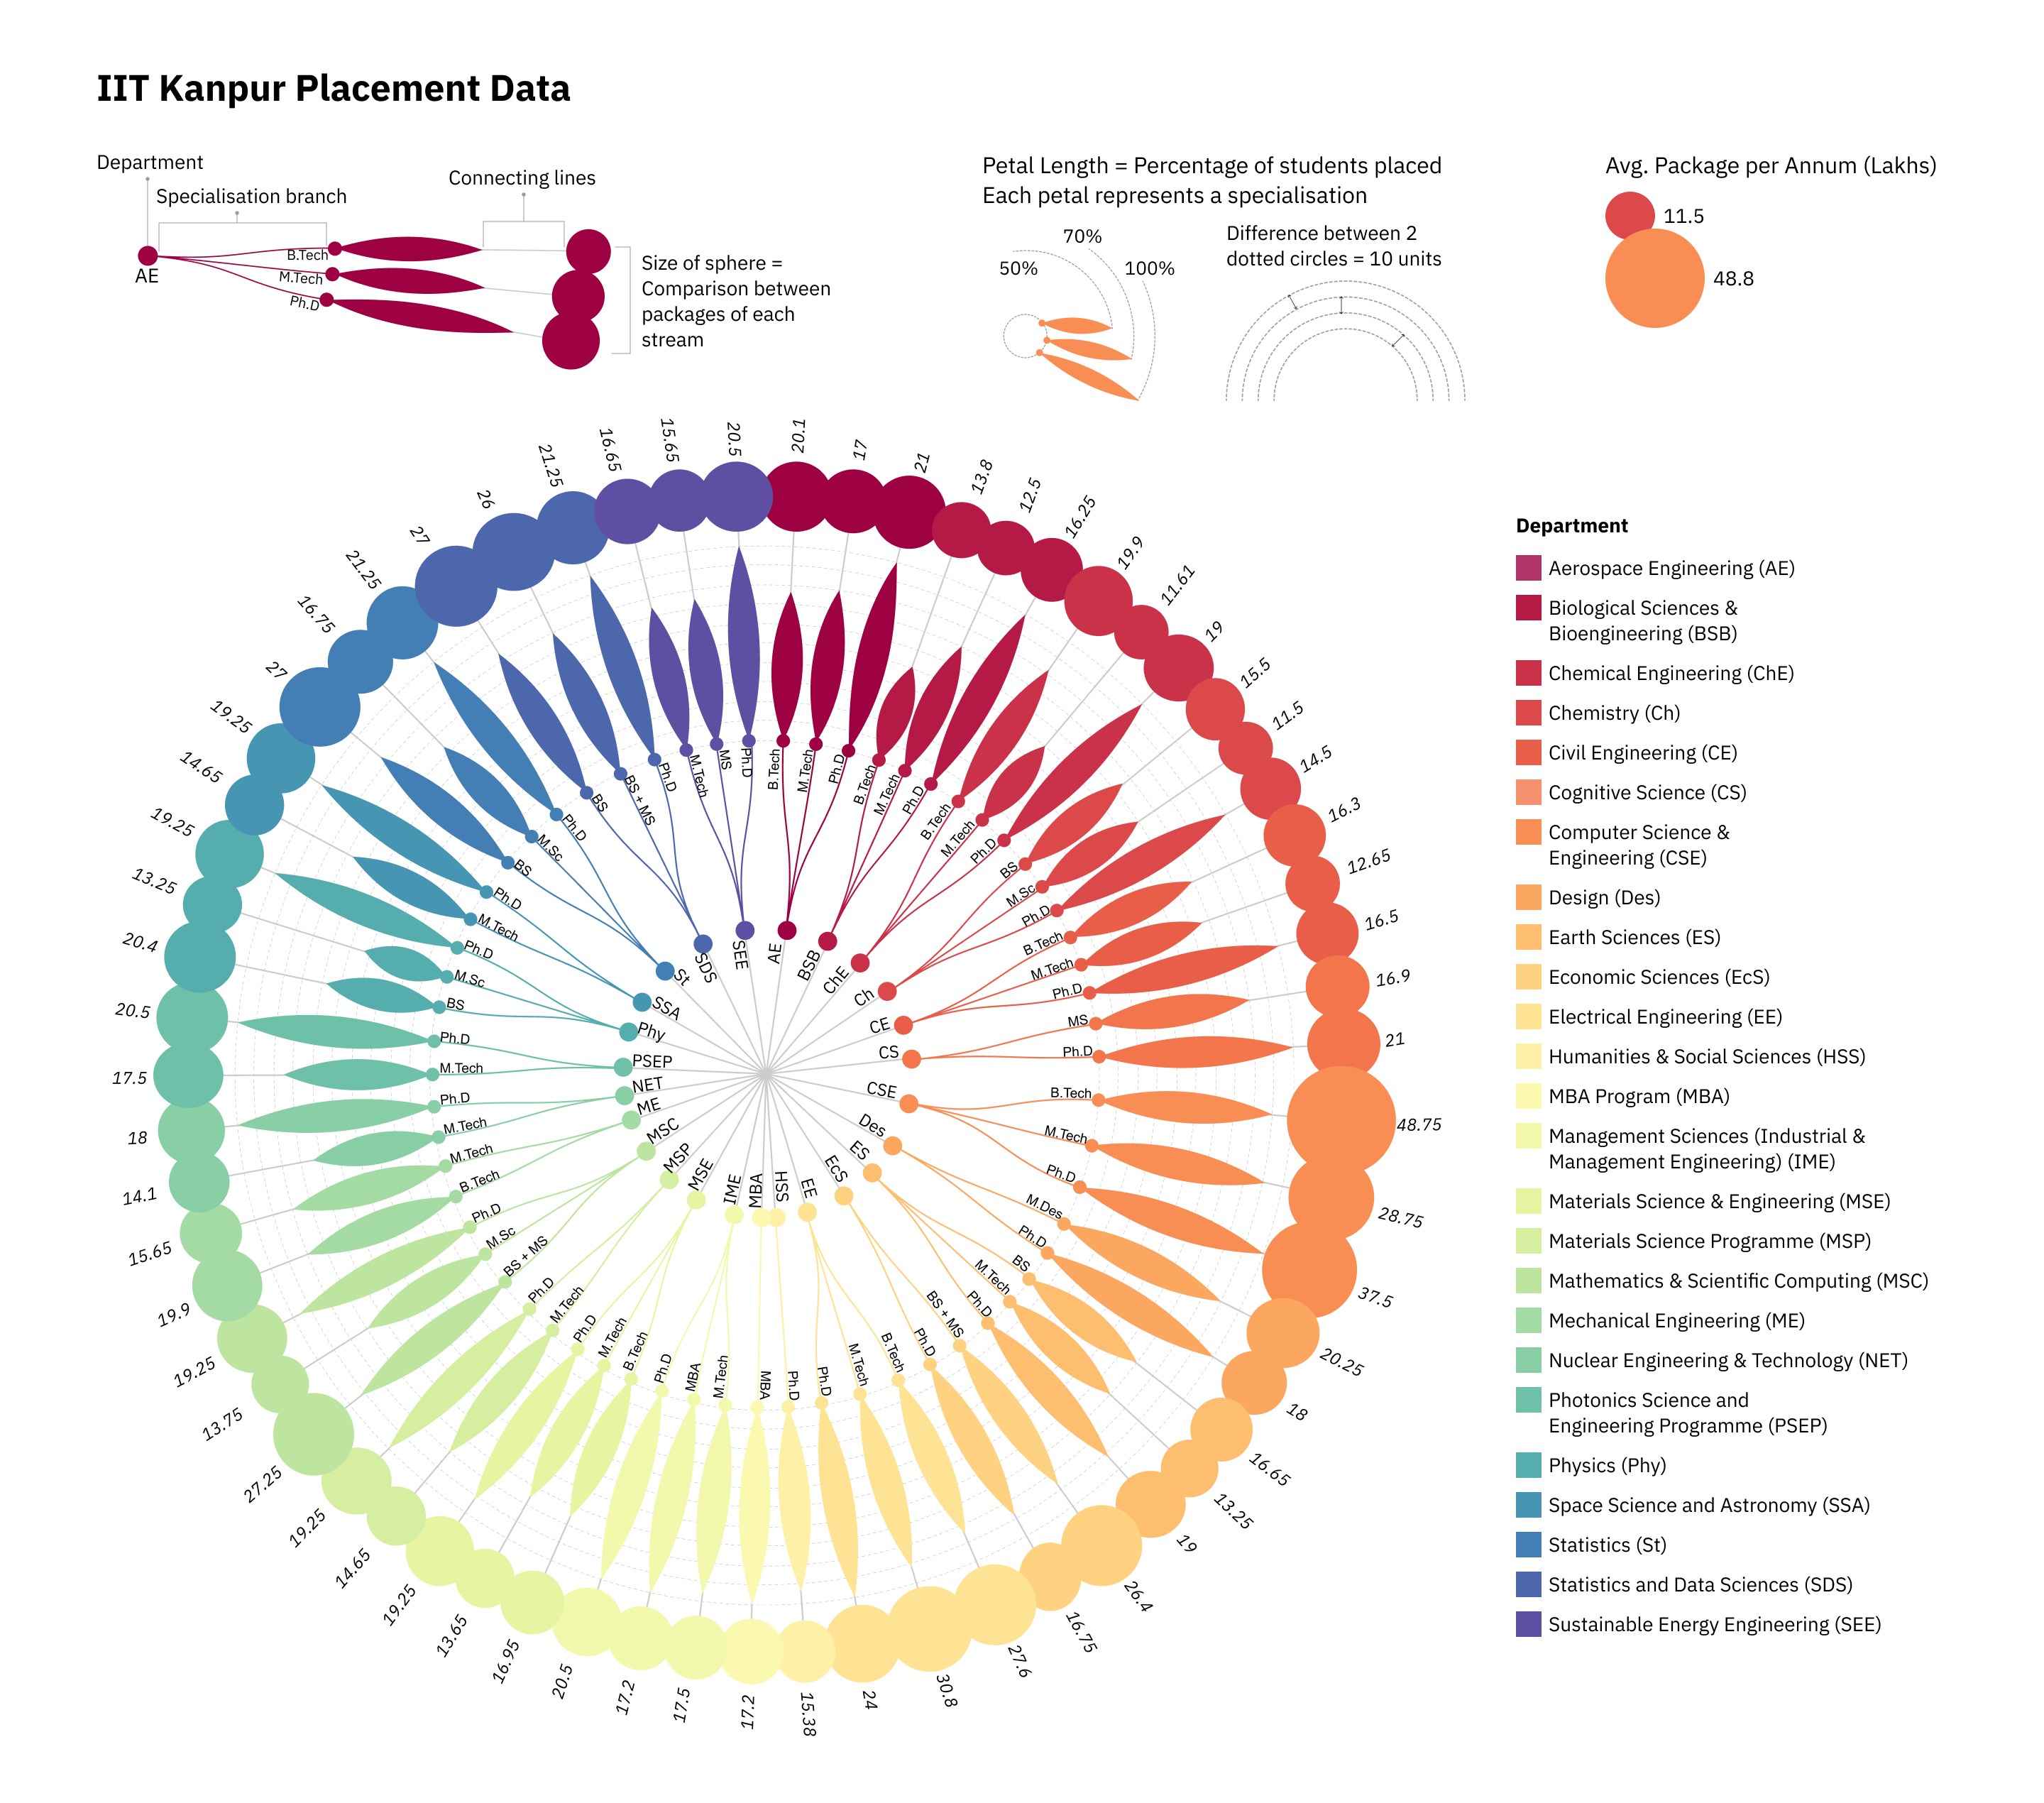
Final visualisation, version 1: the radial petal chart coloured by department, with legend and department key
Final visualisation, version 1
Stage 3 · Colour explorations

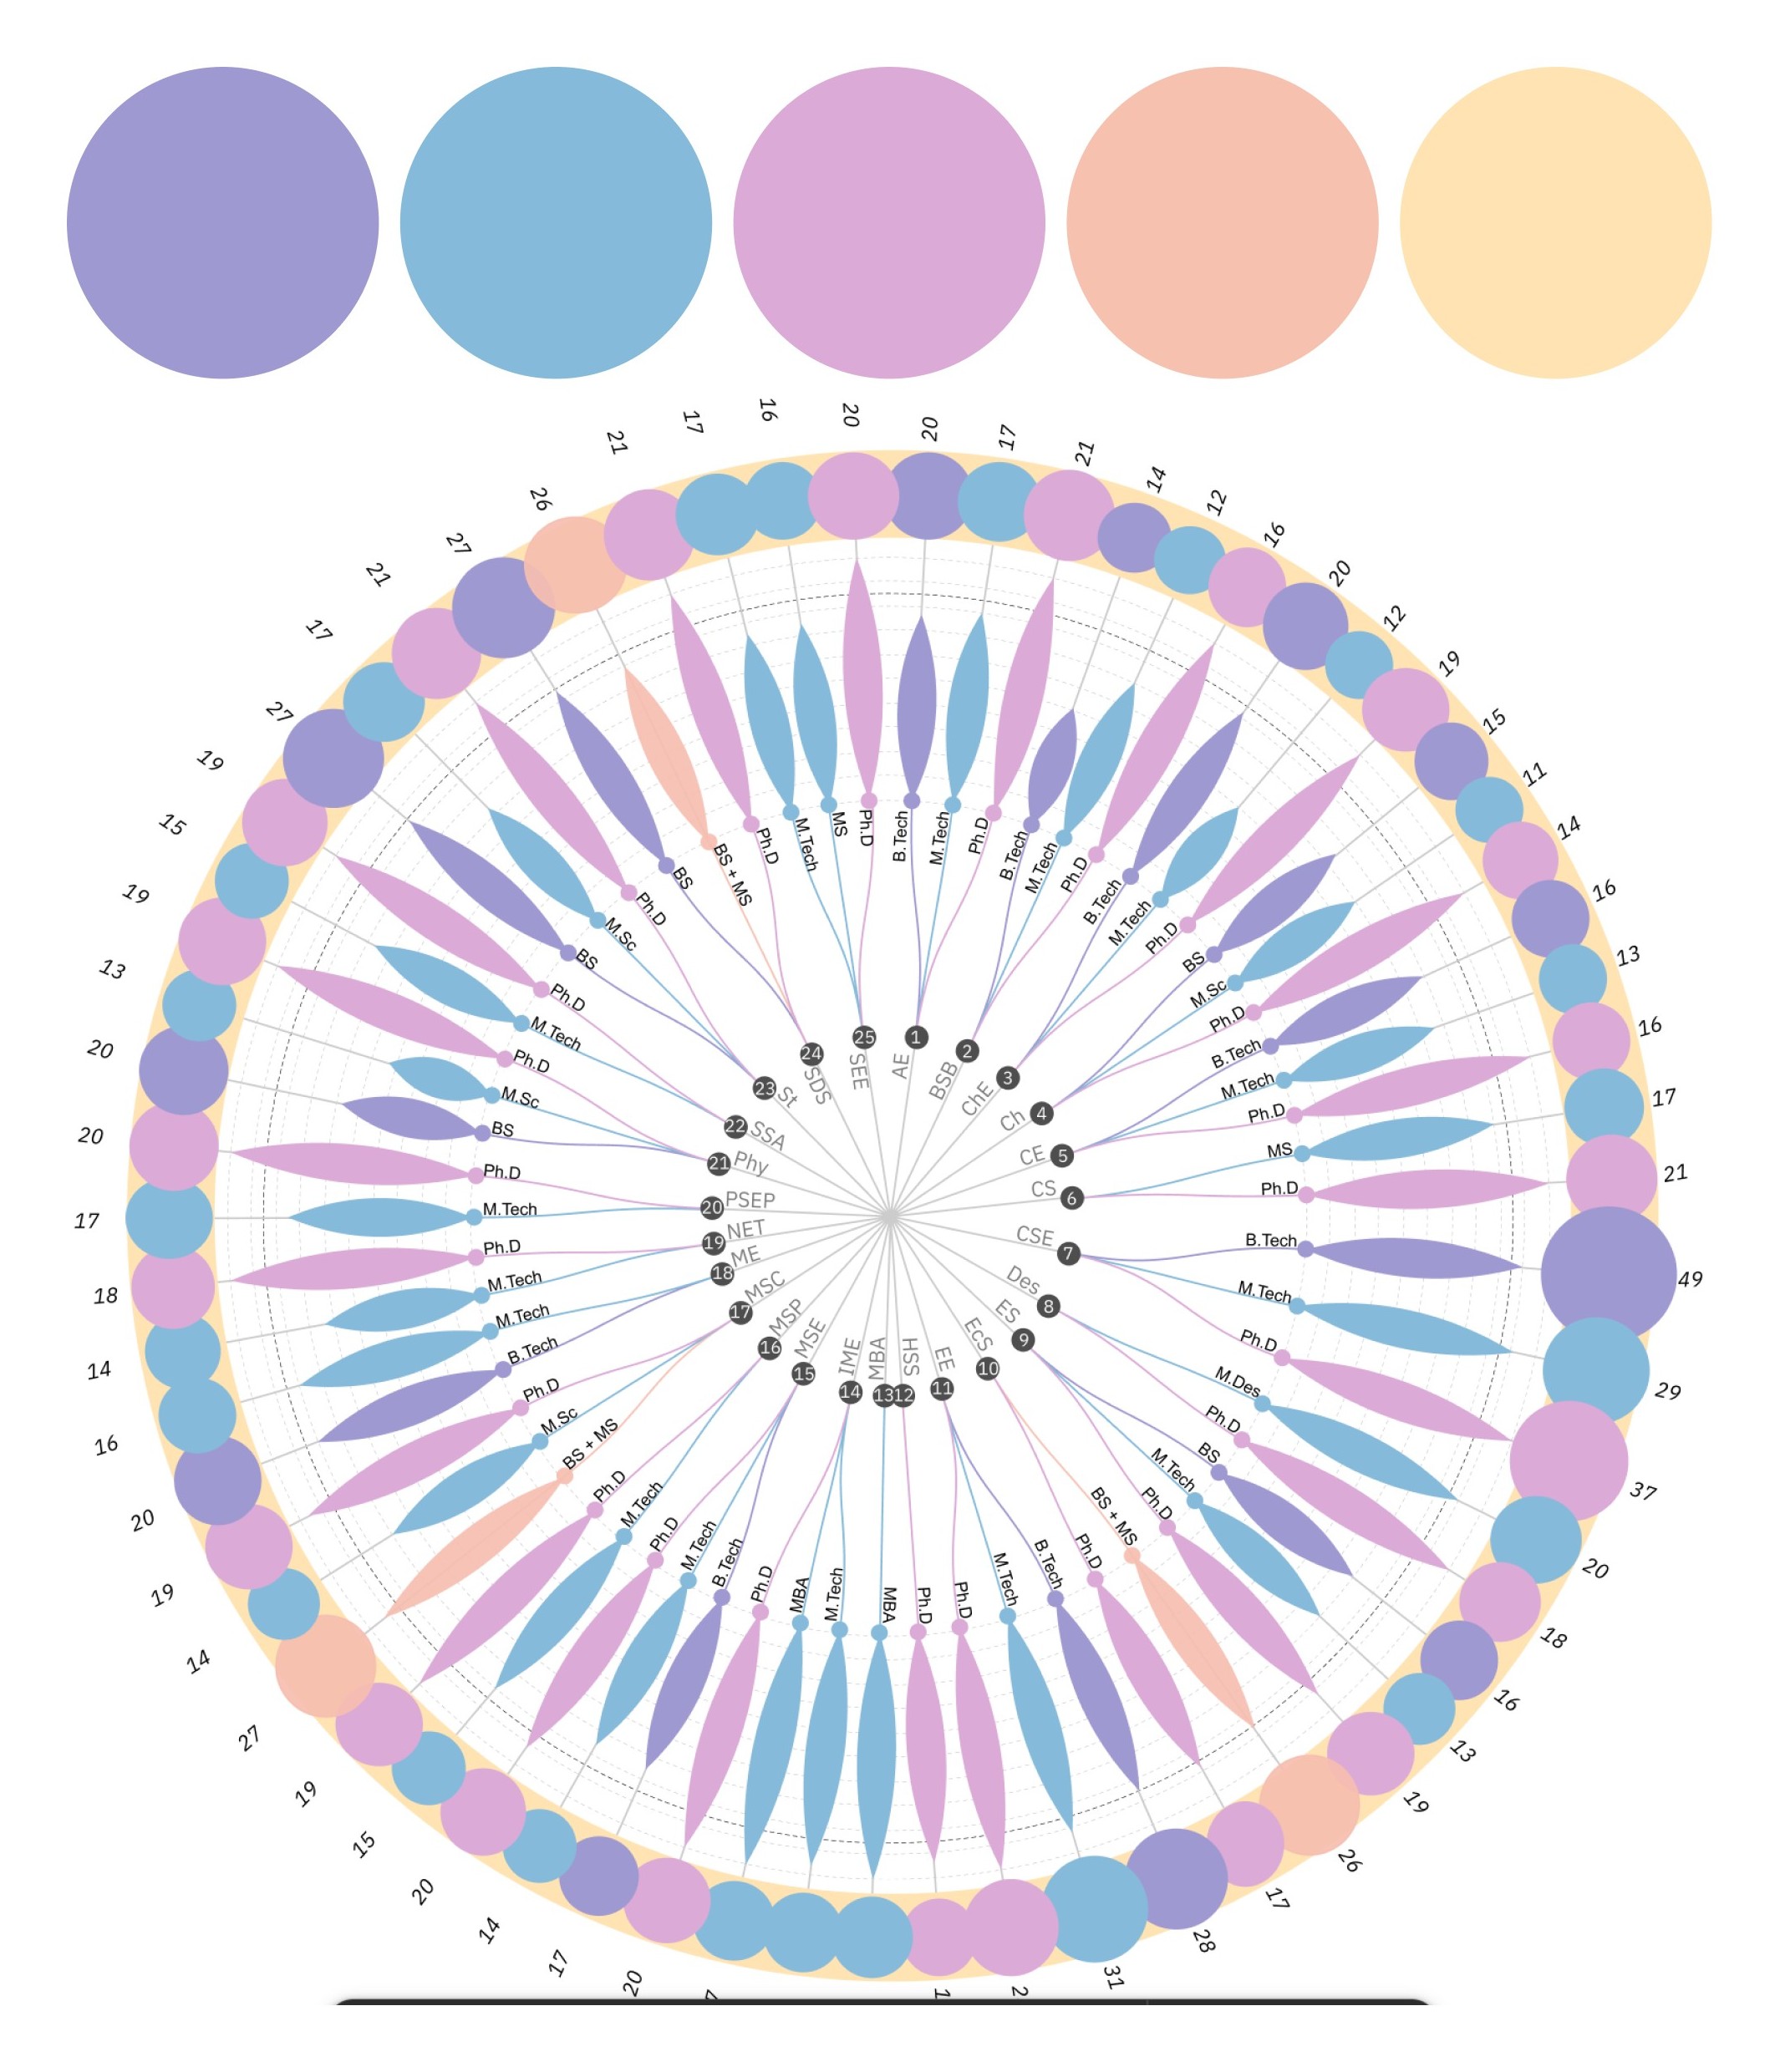
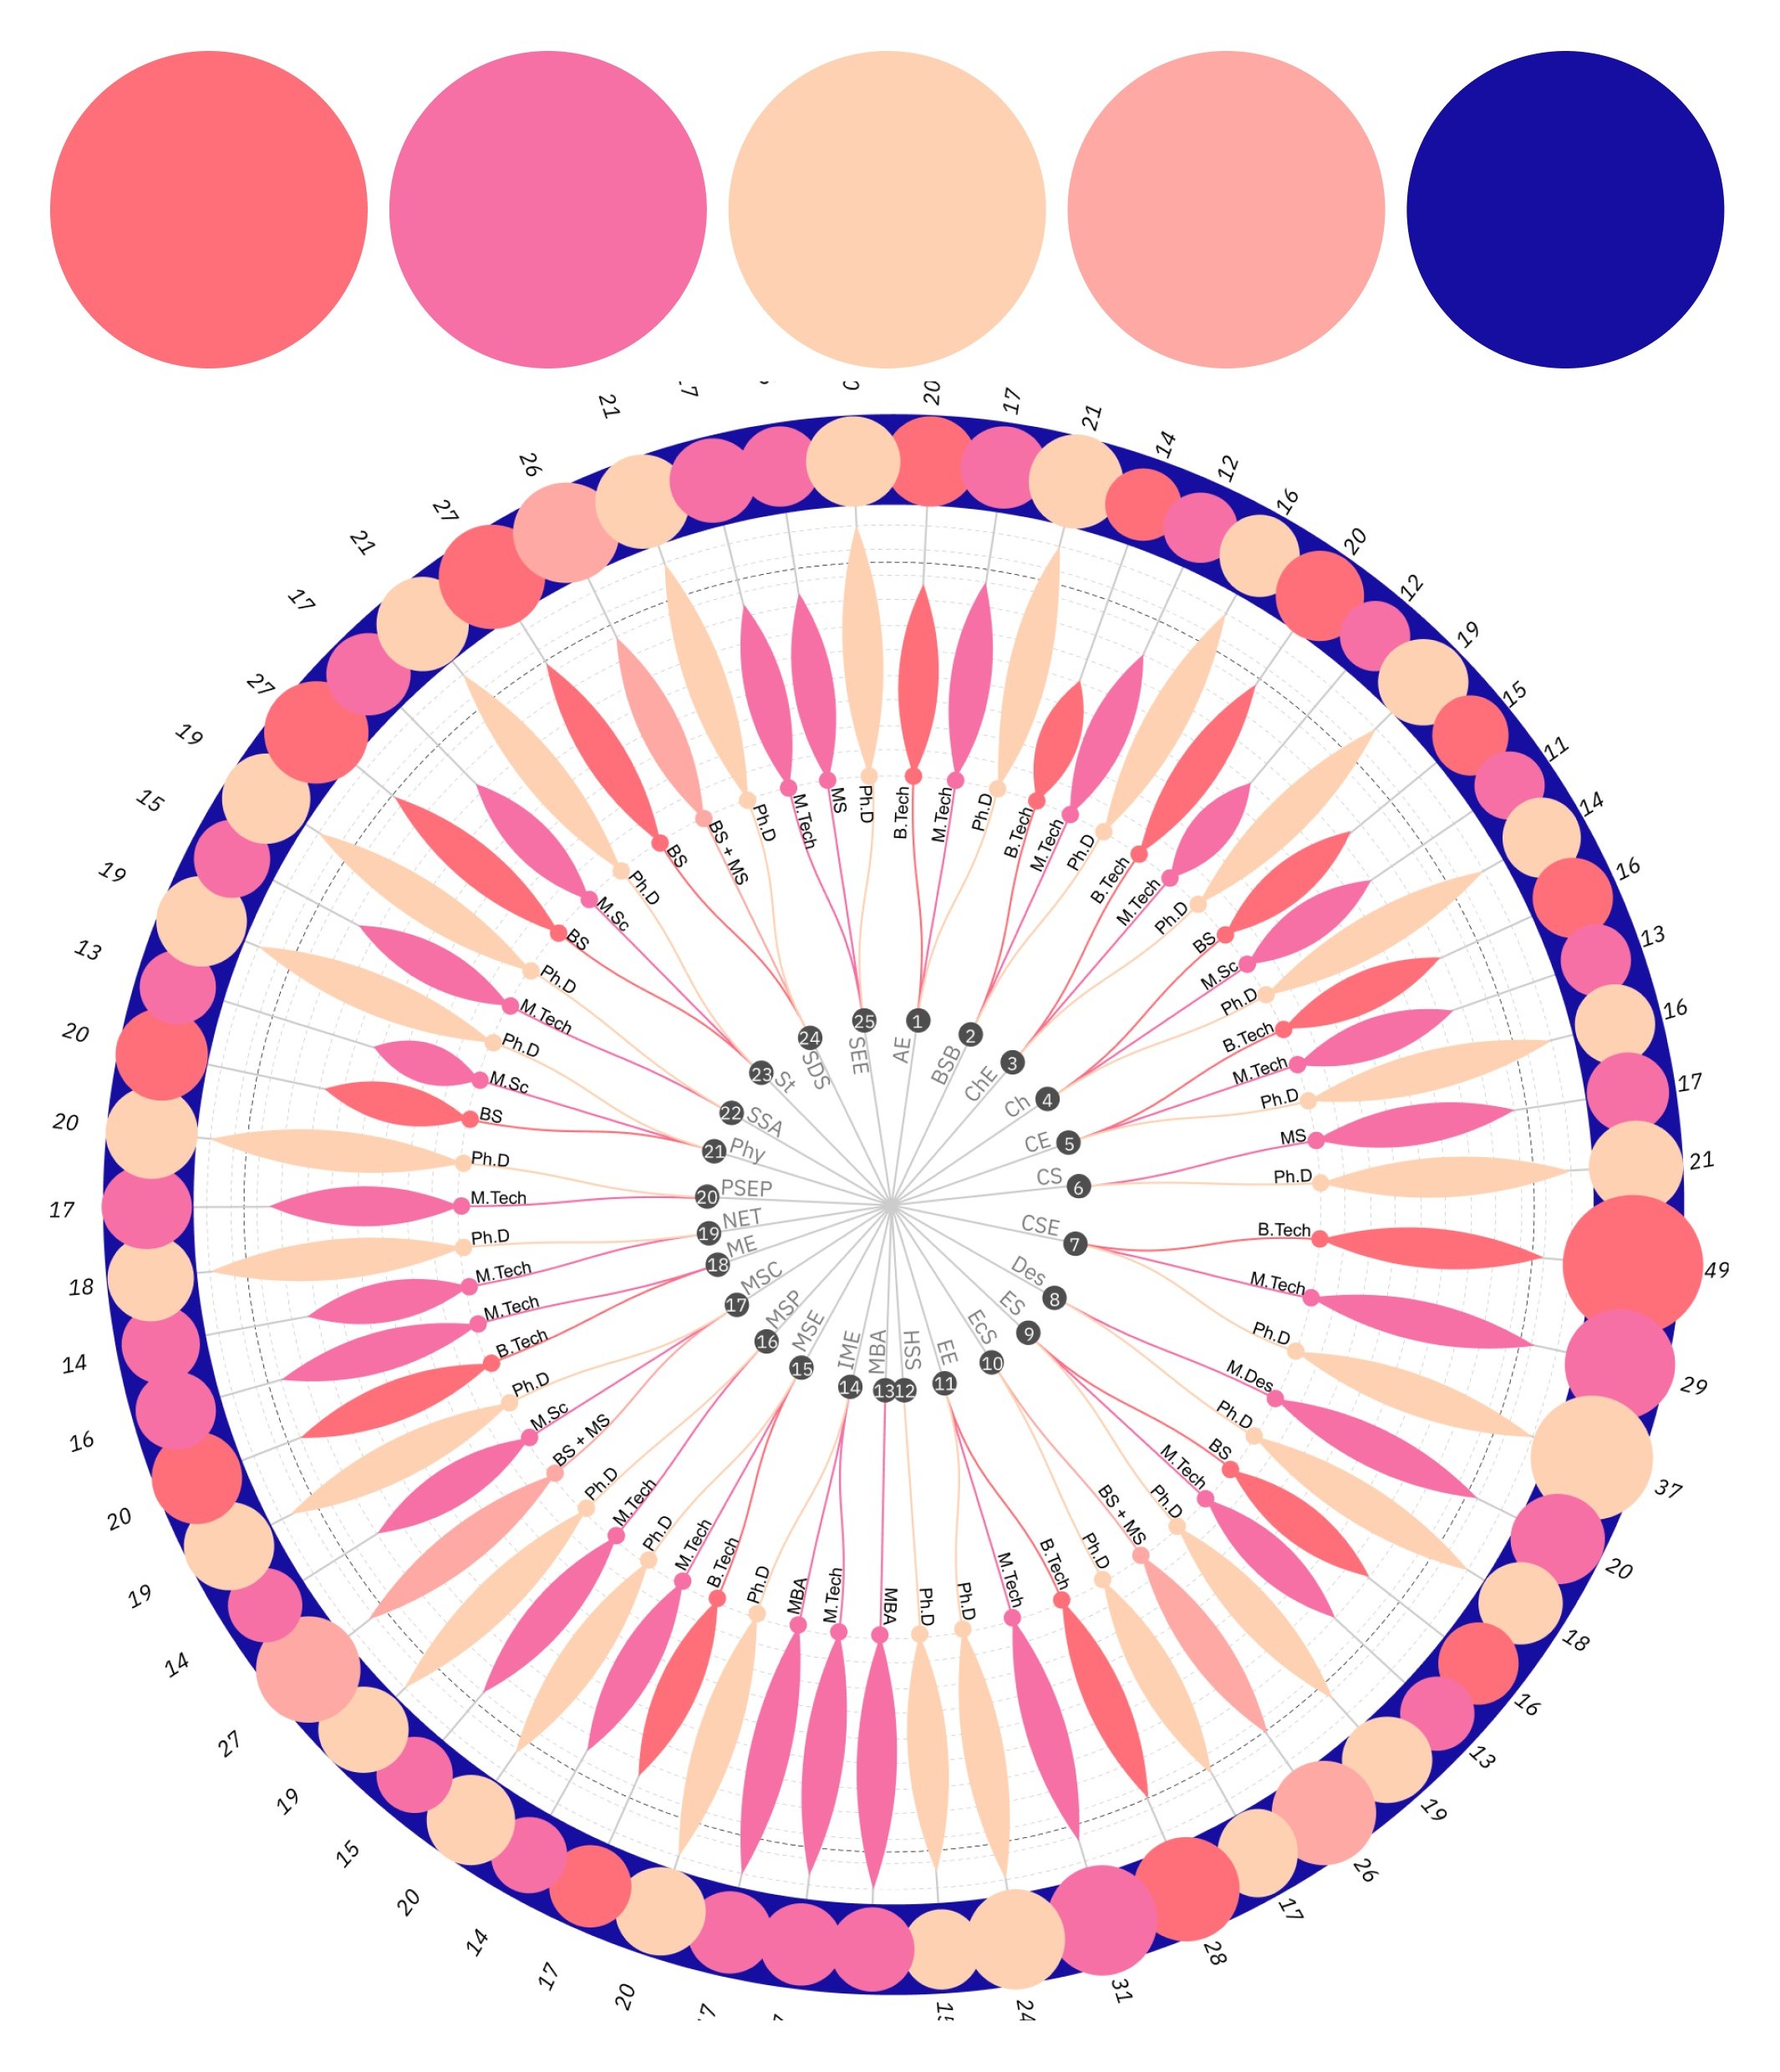
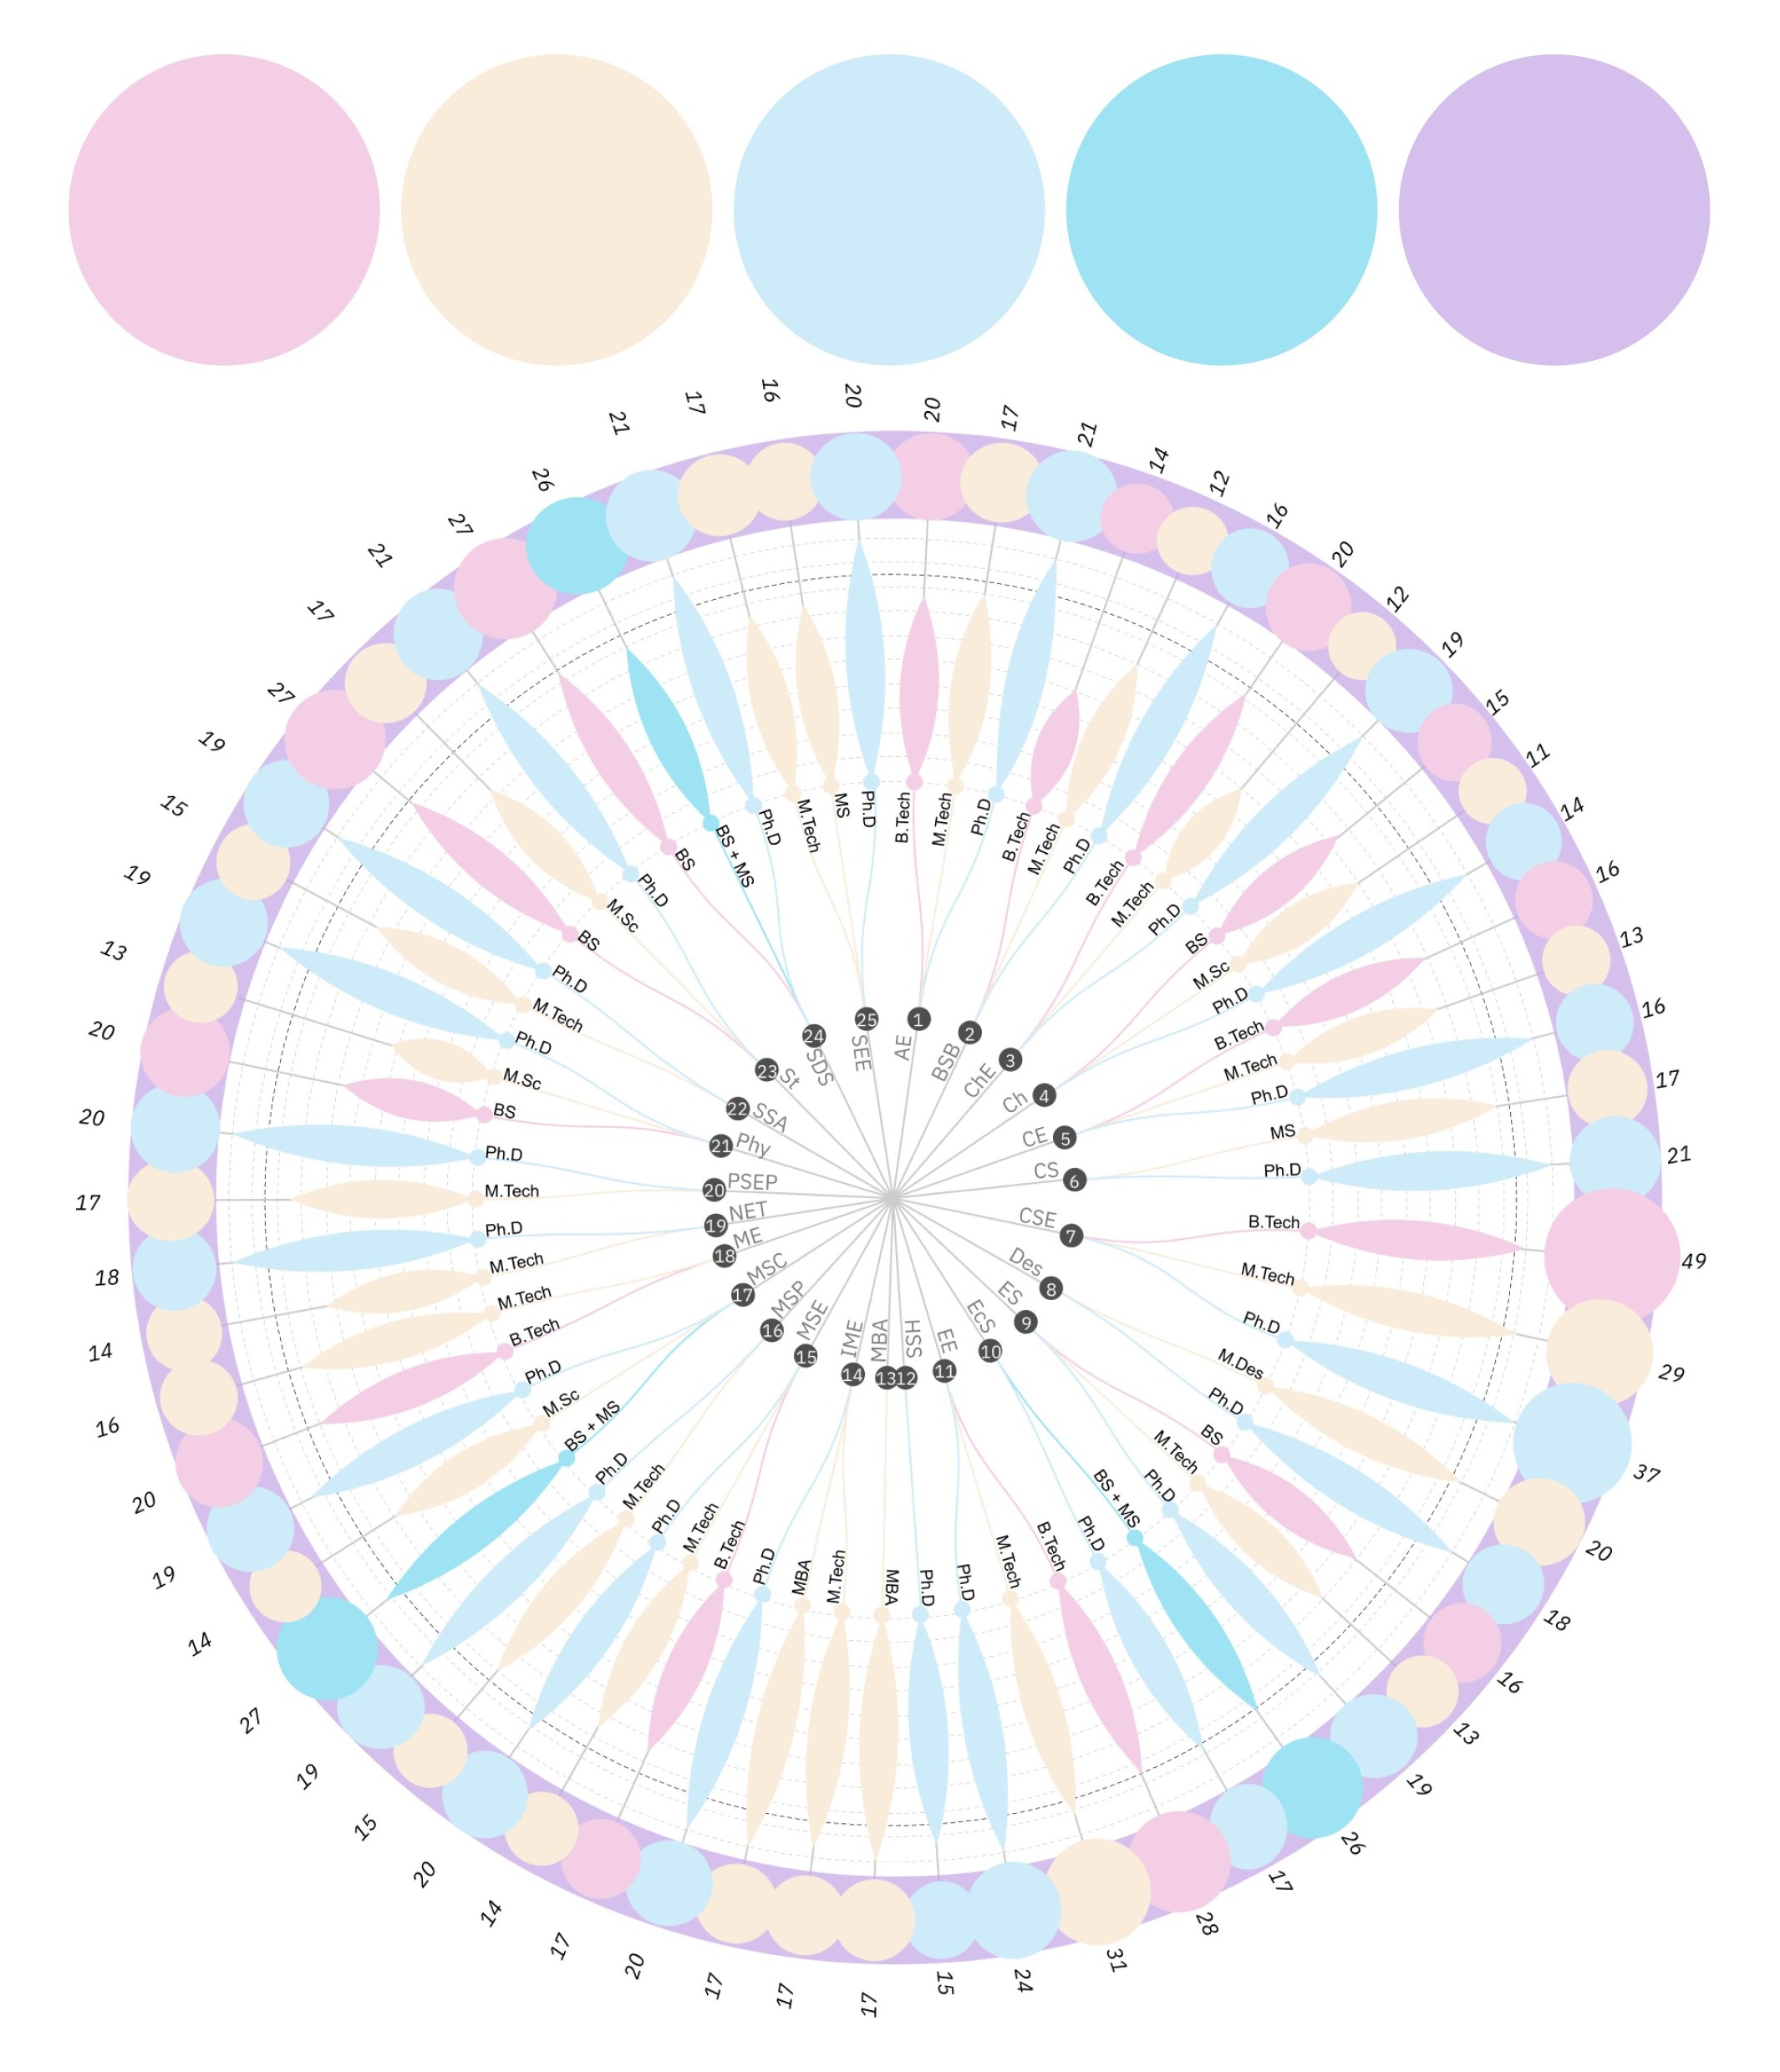
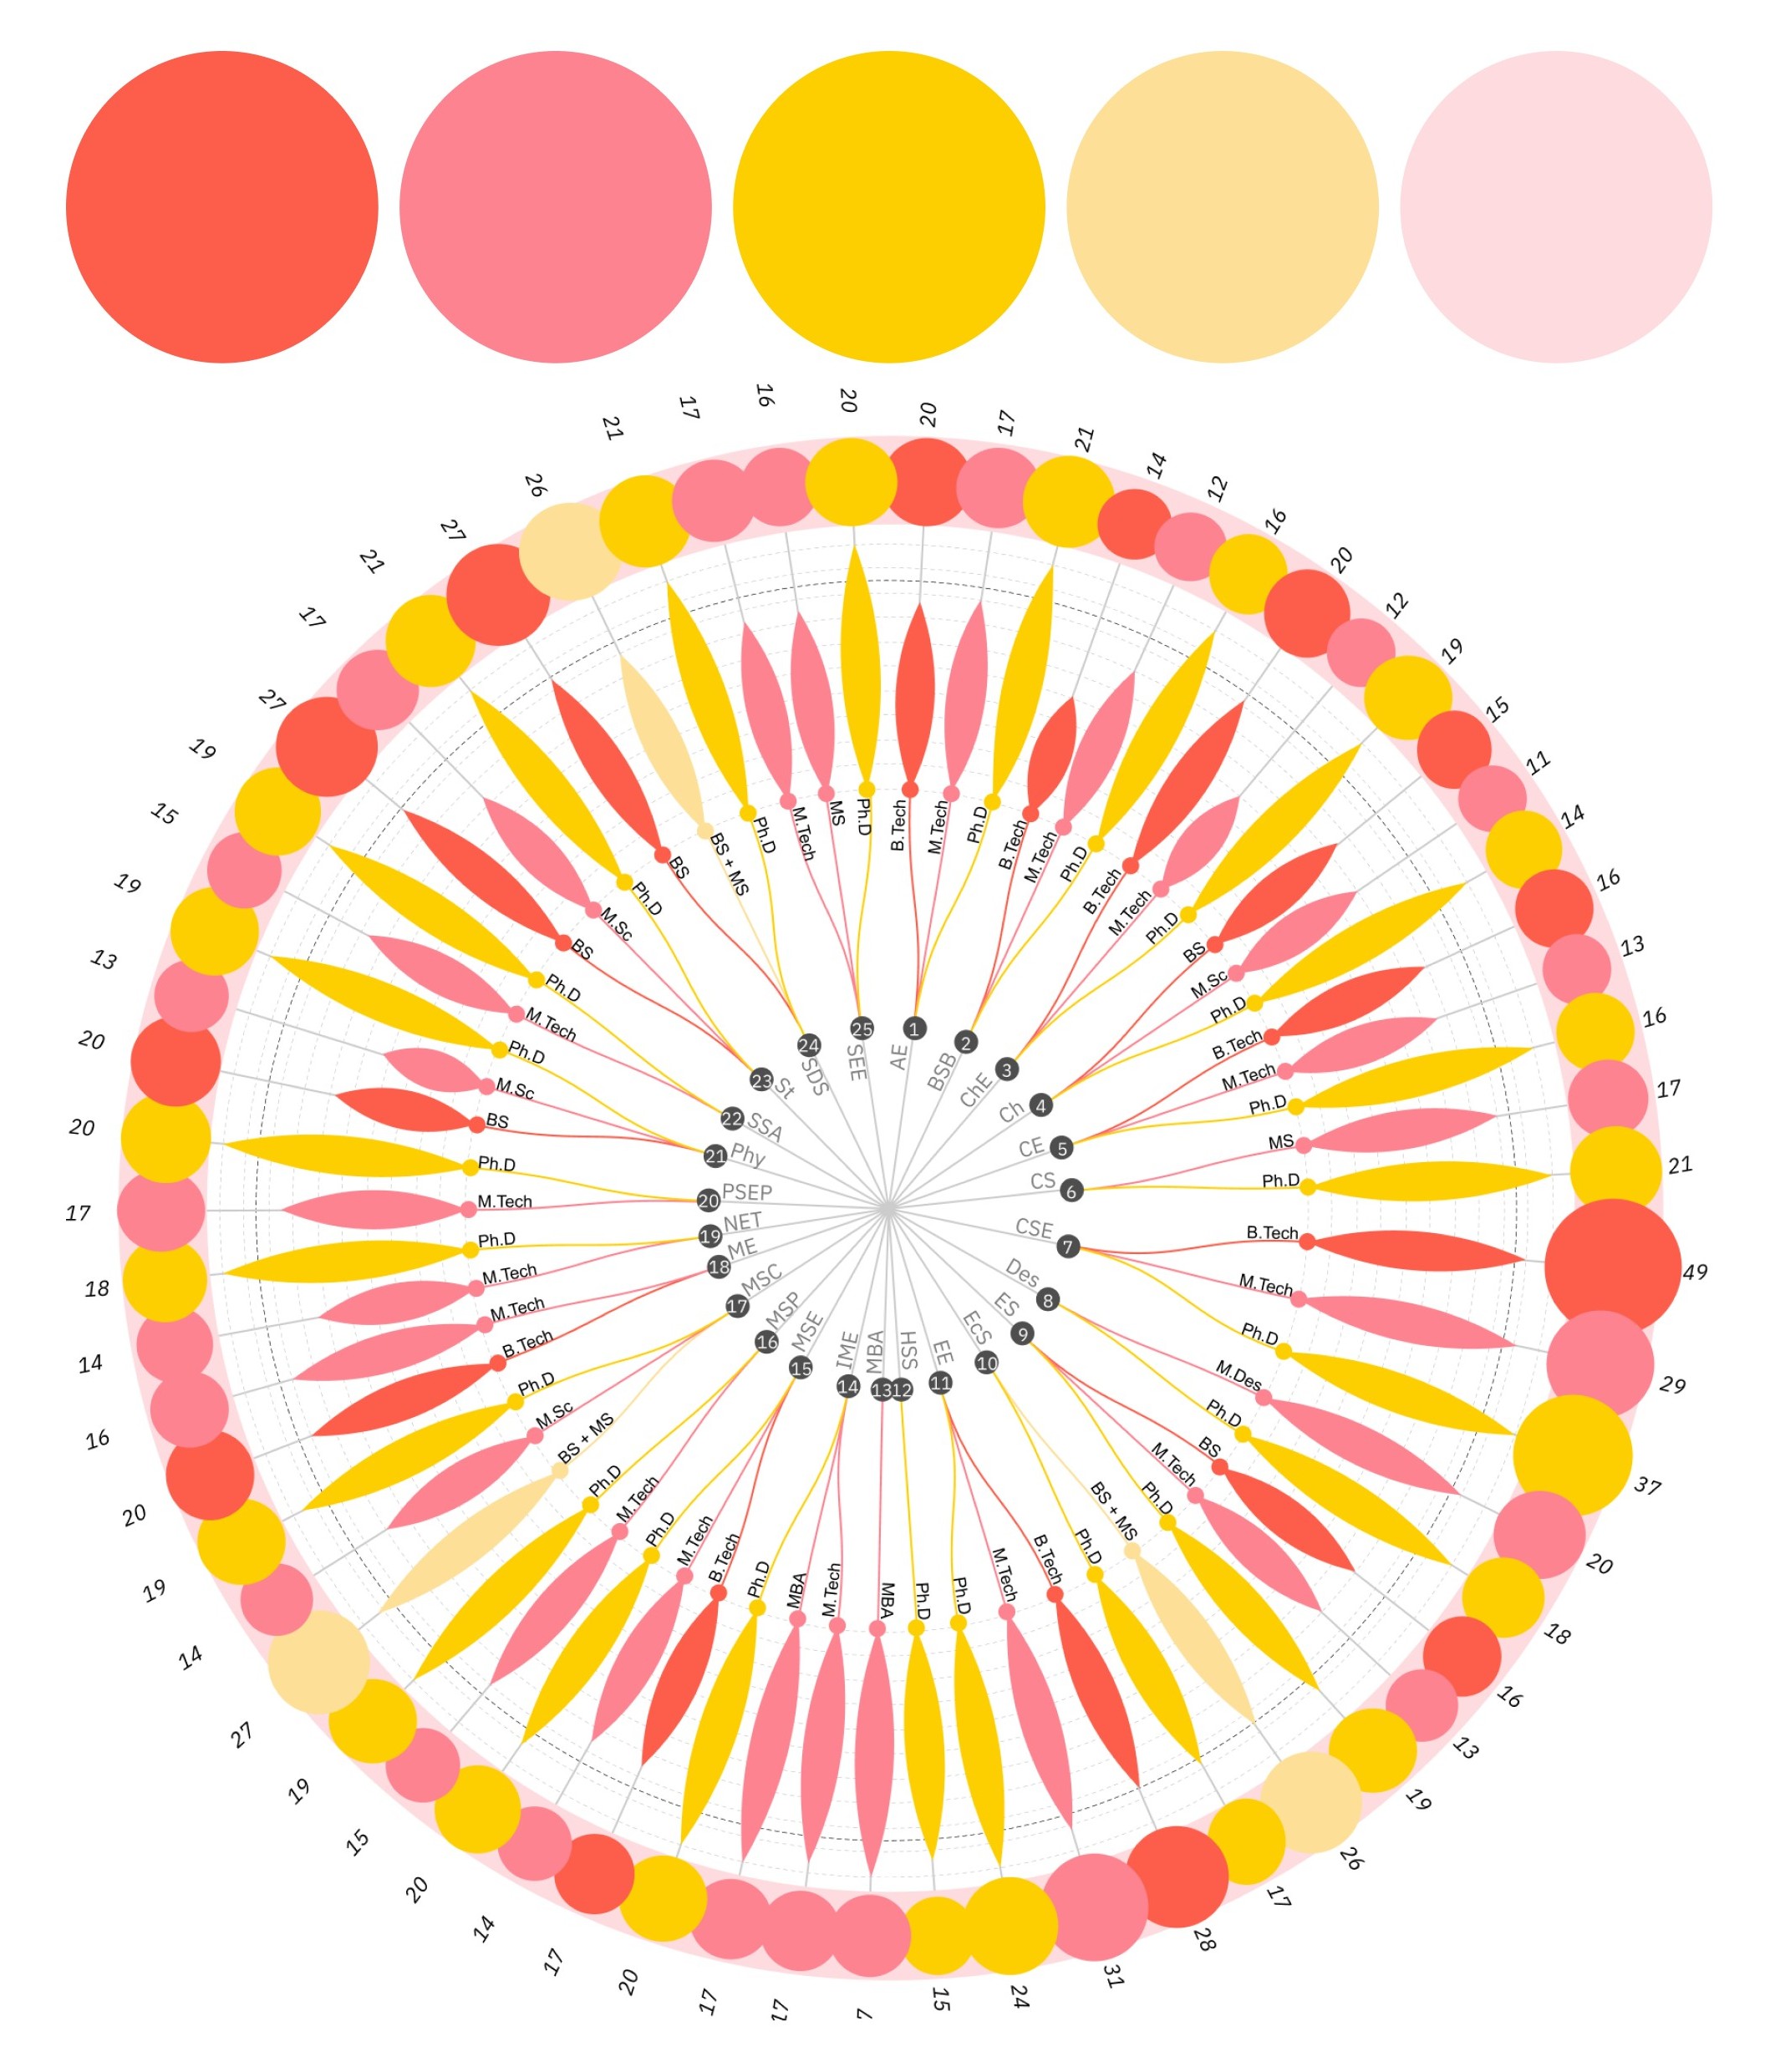
Nine colour harmonies

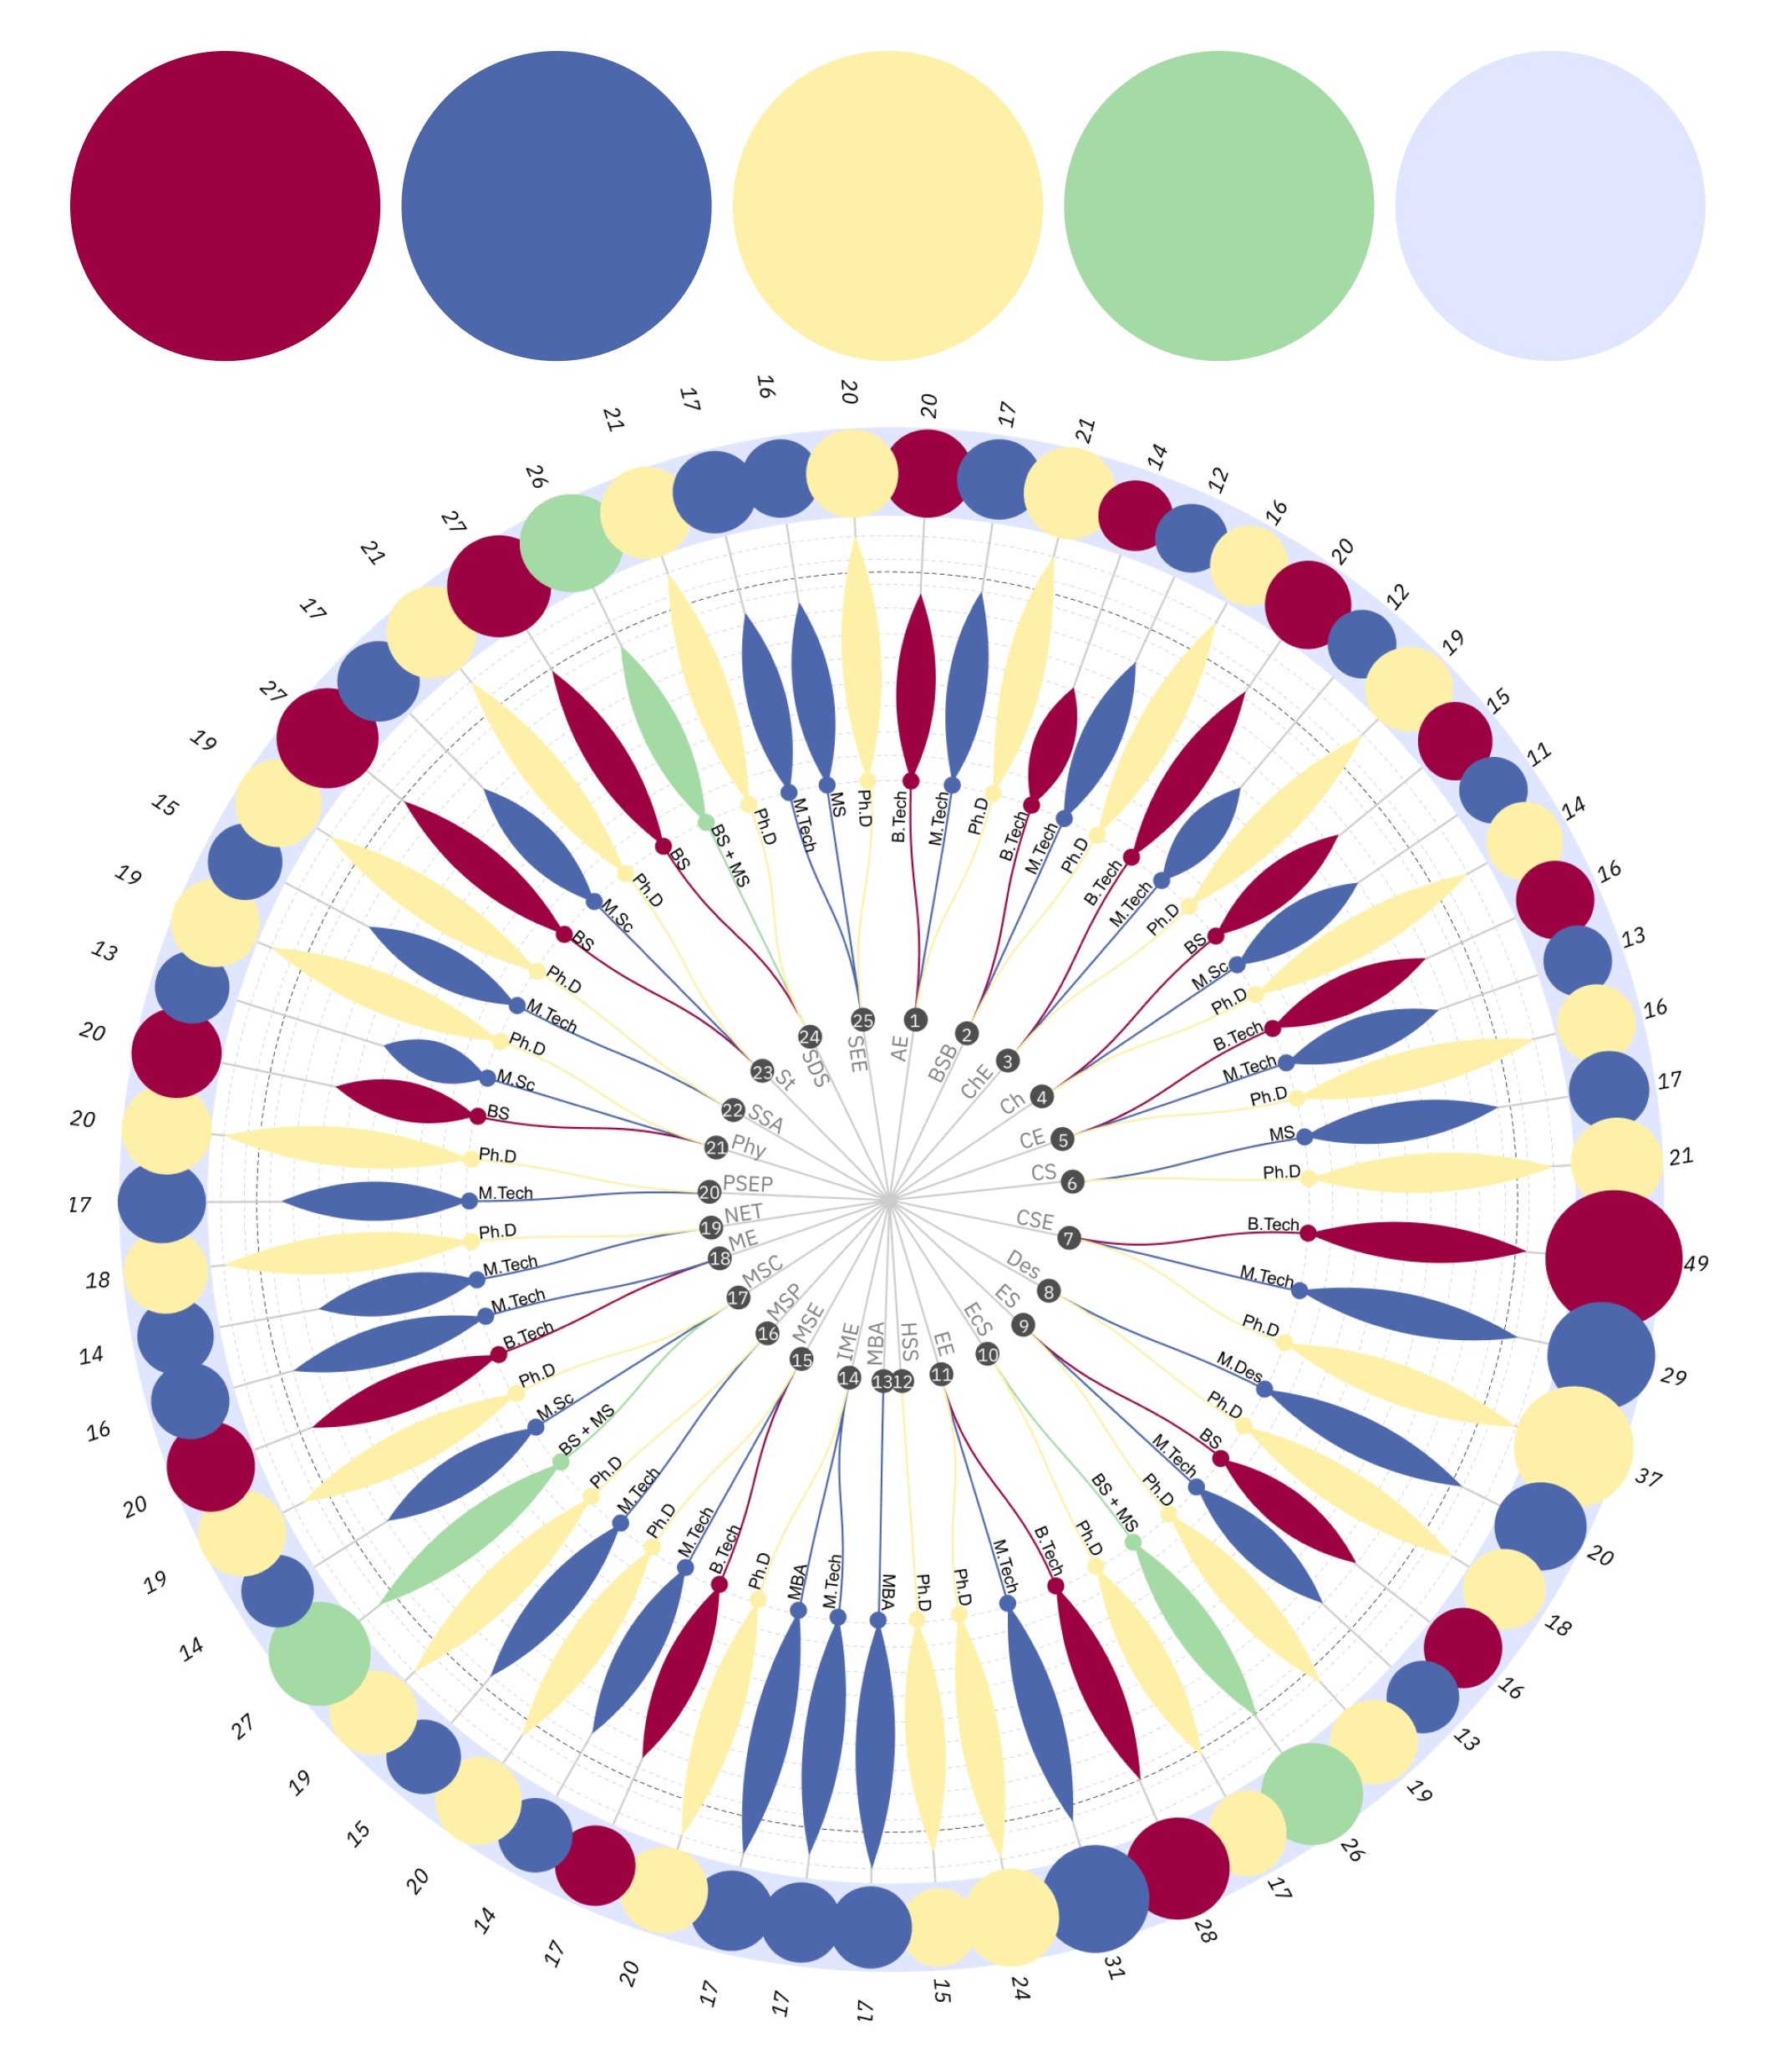
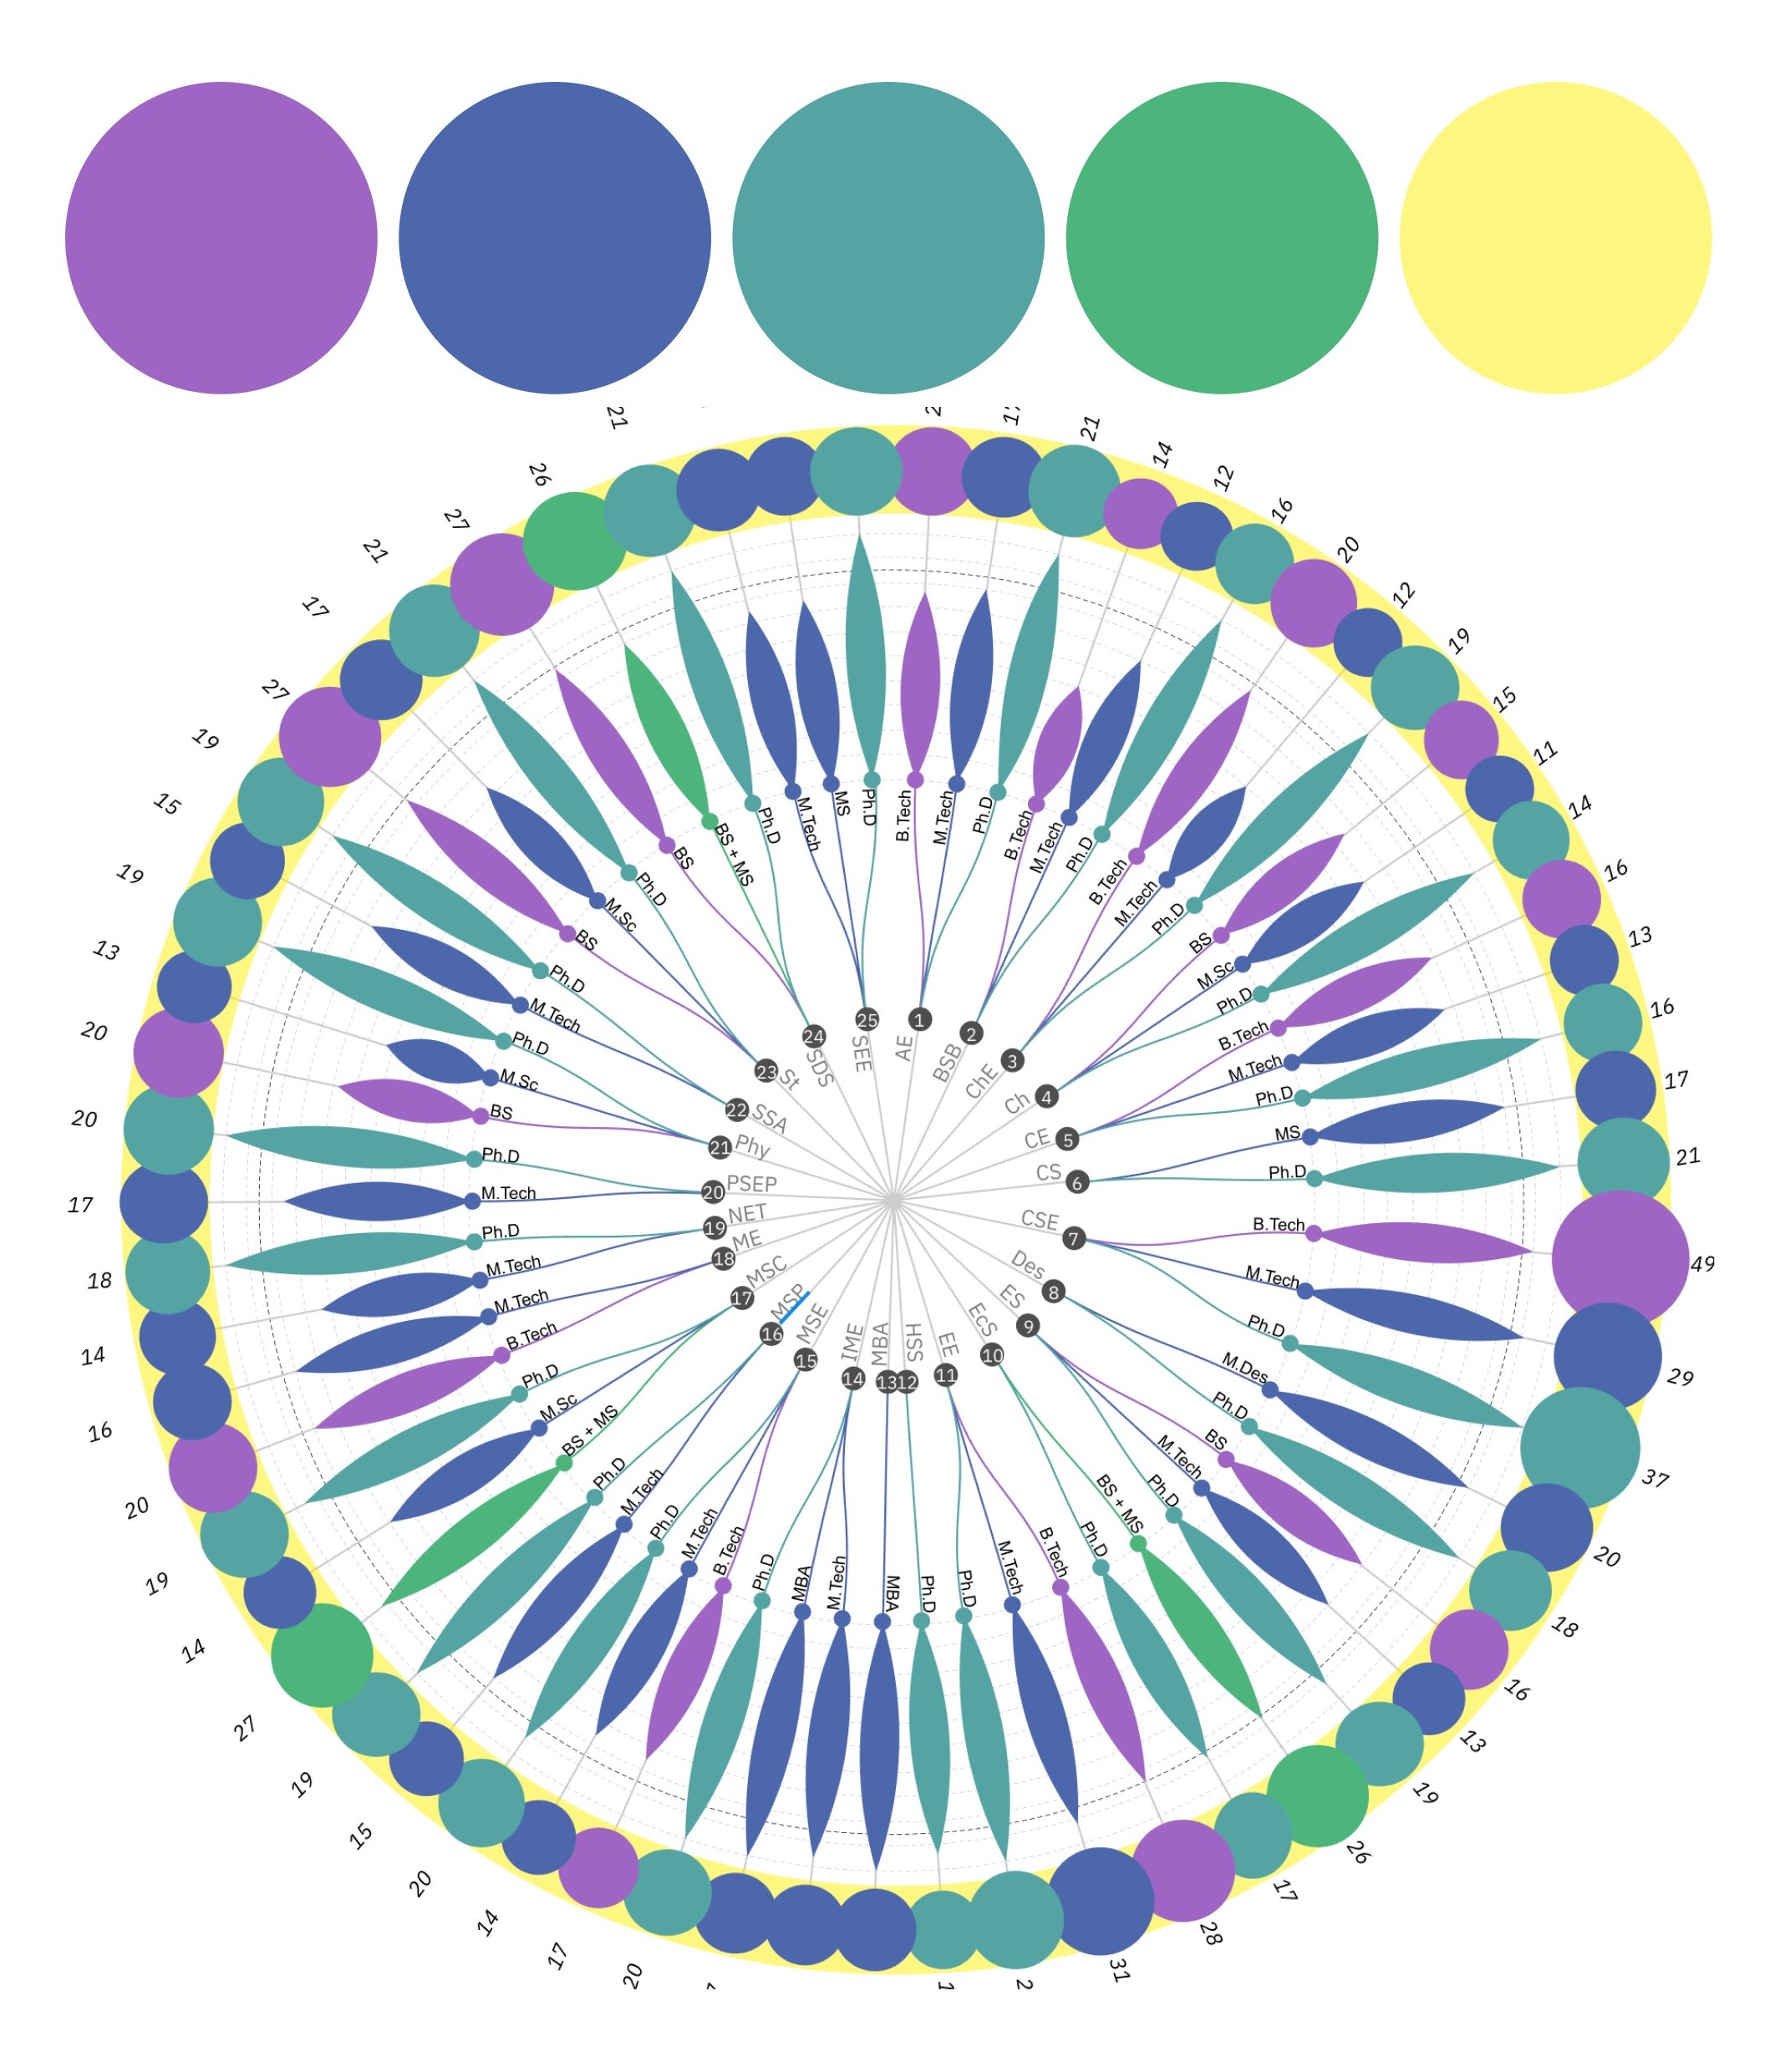
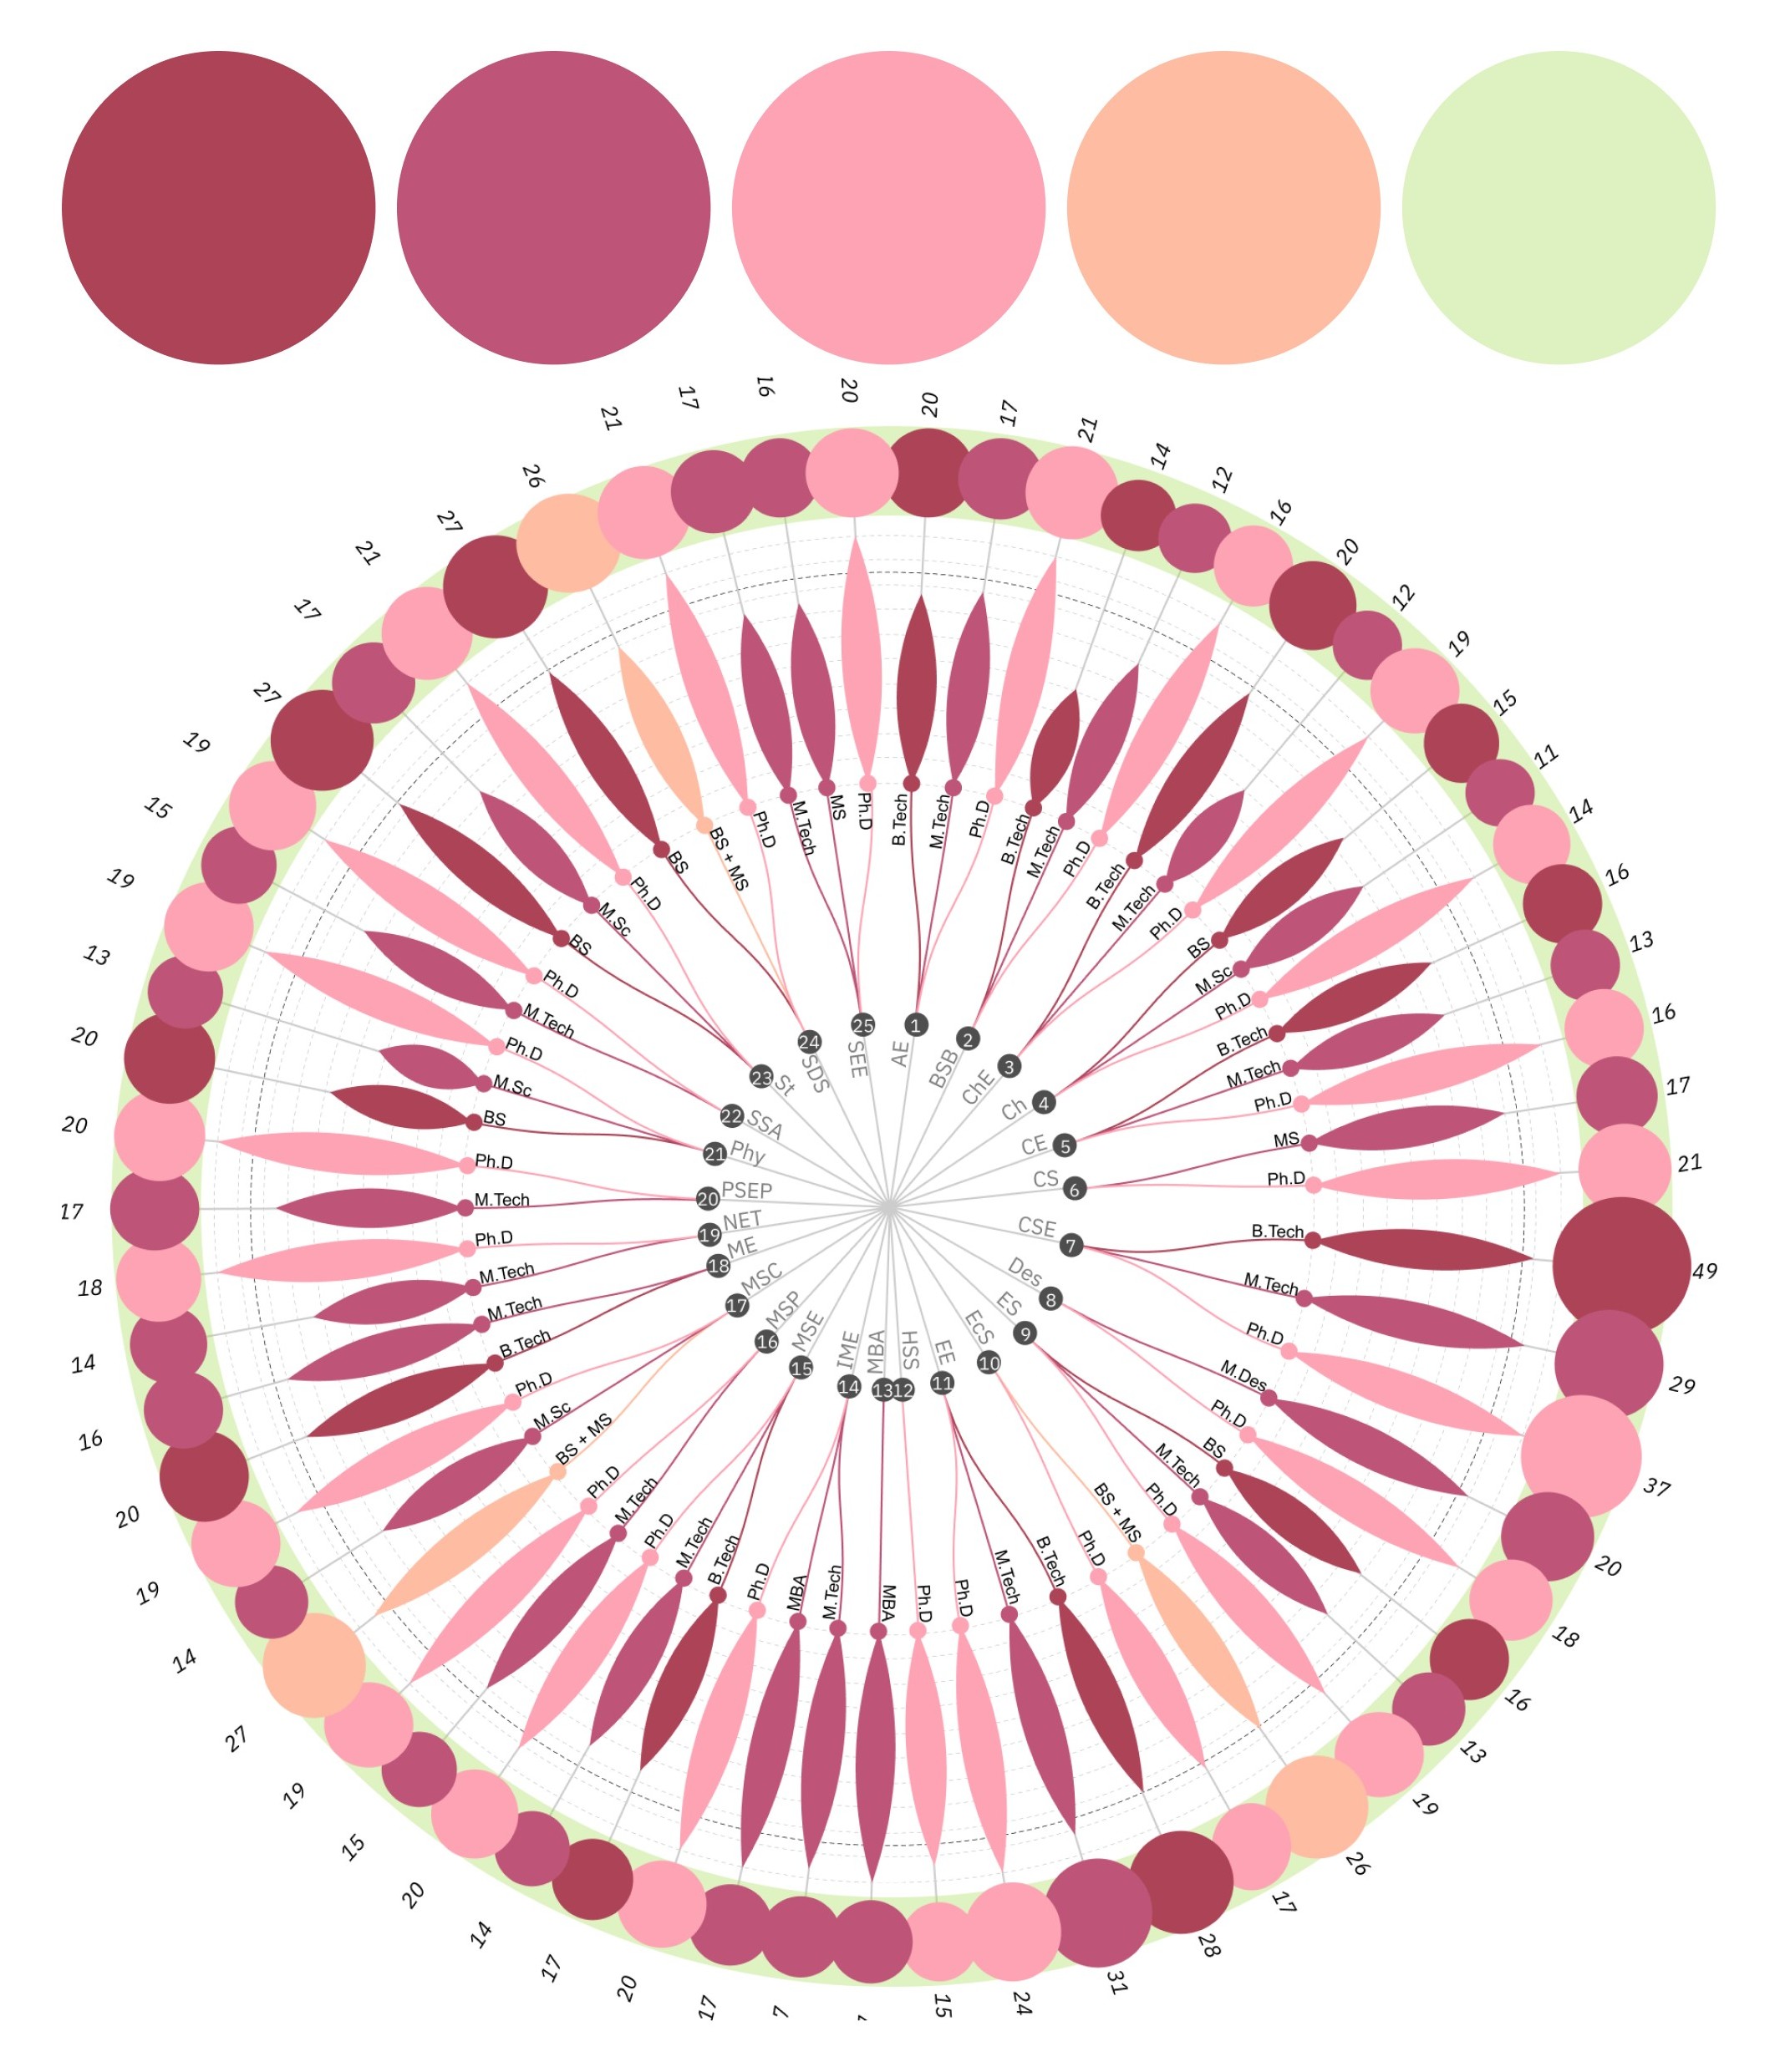
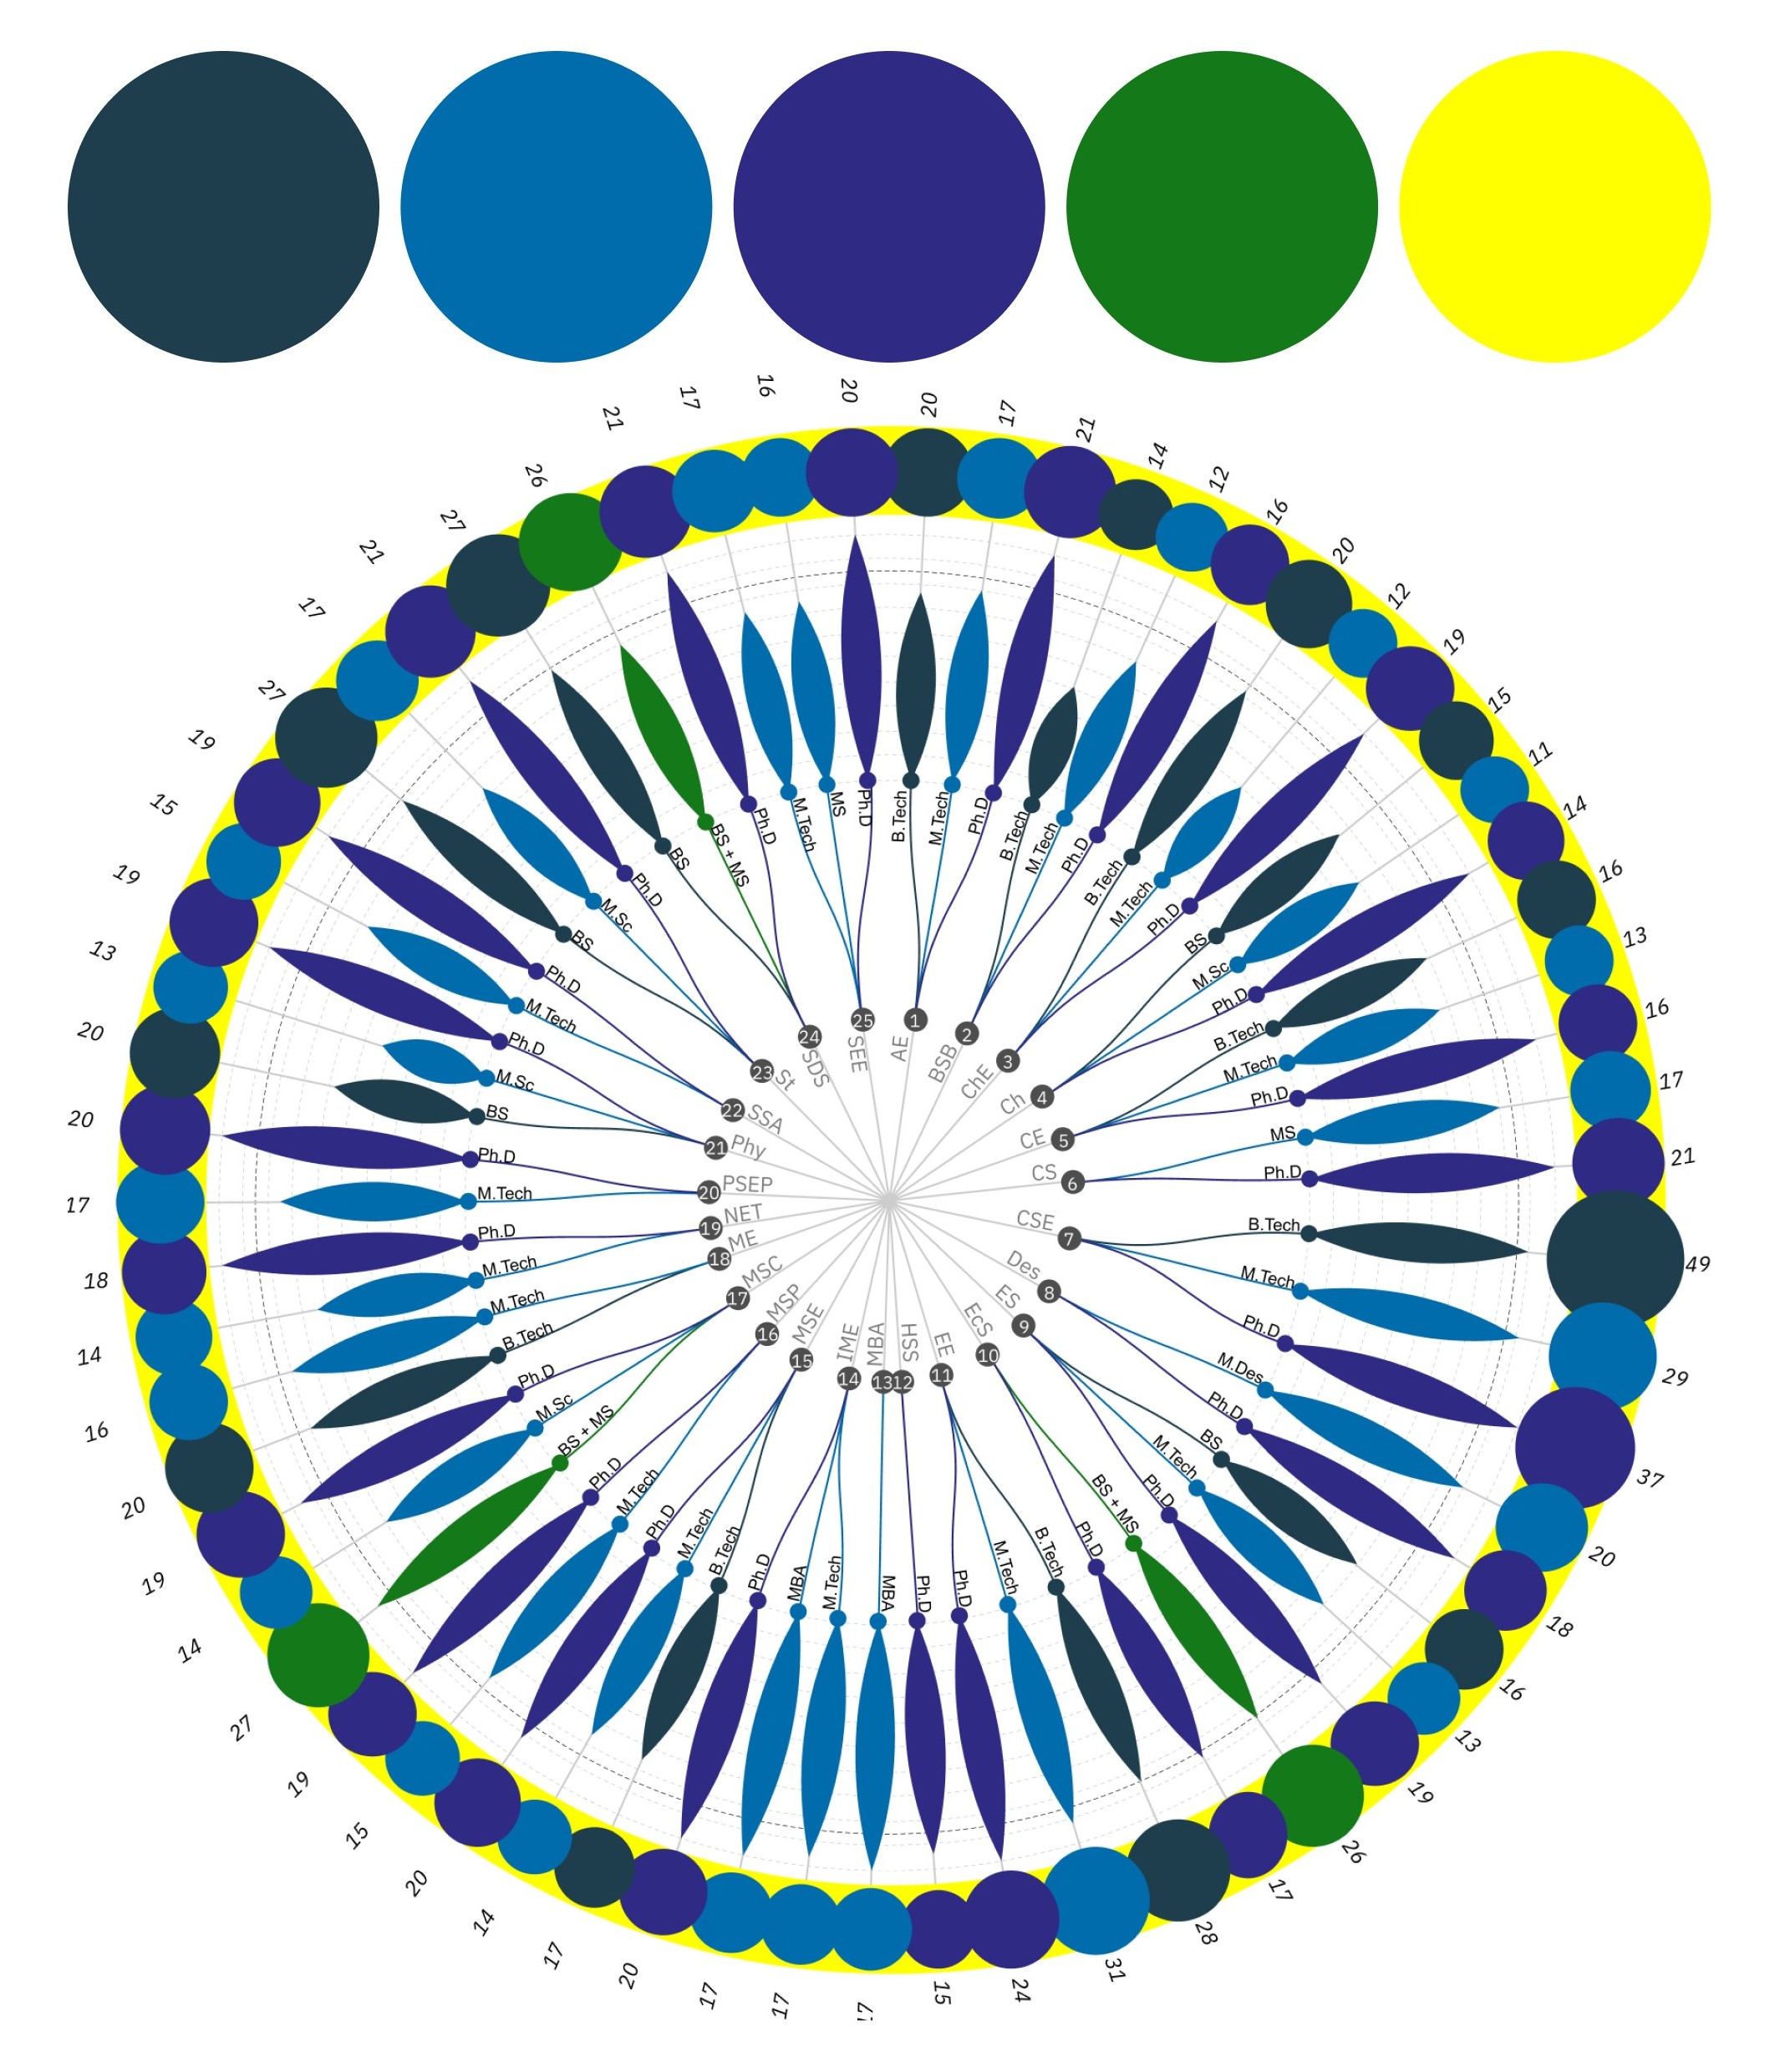
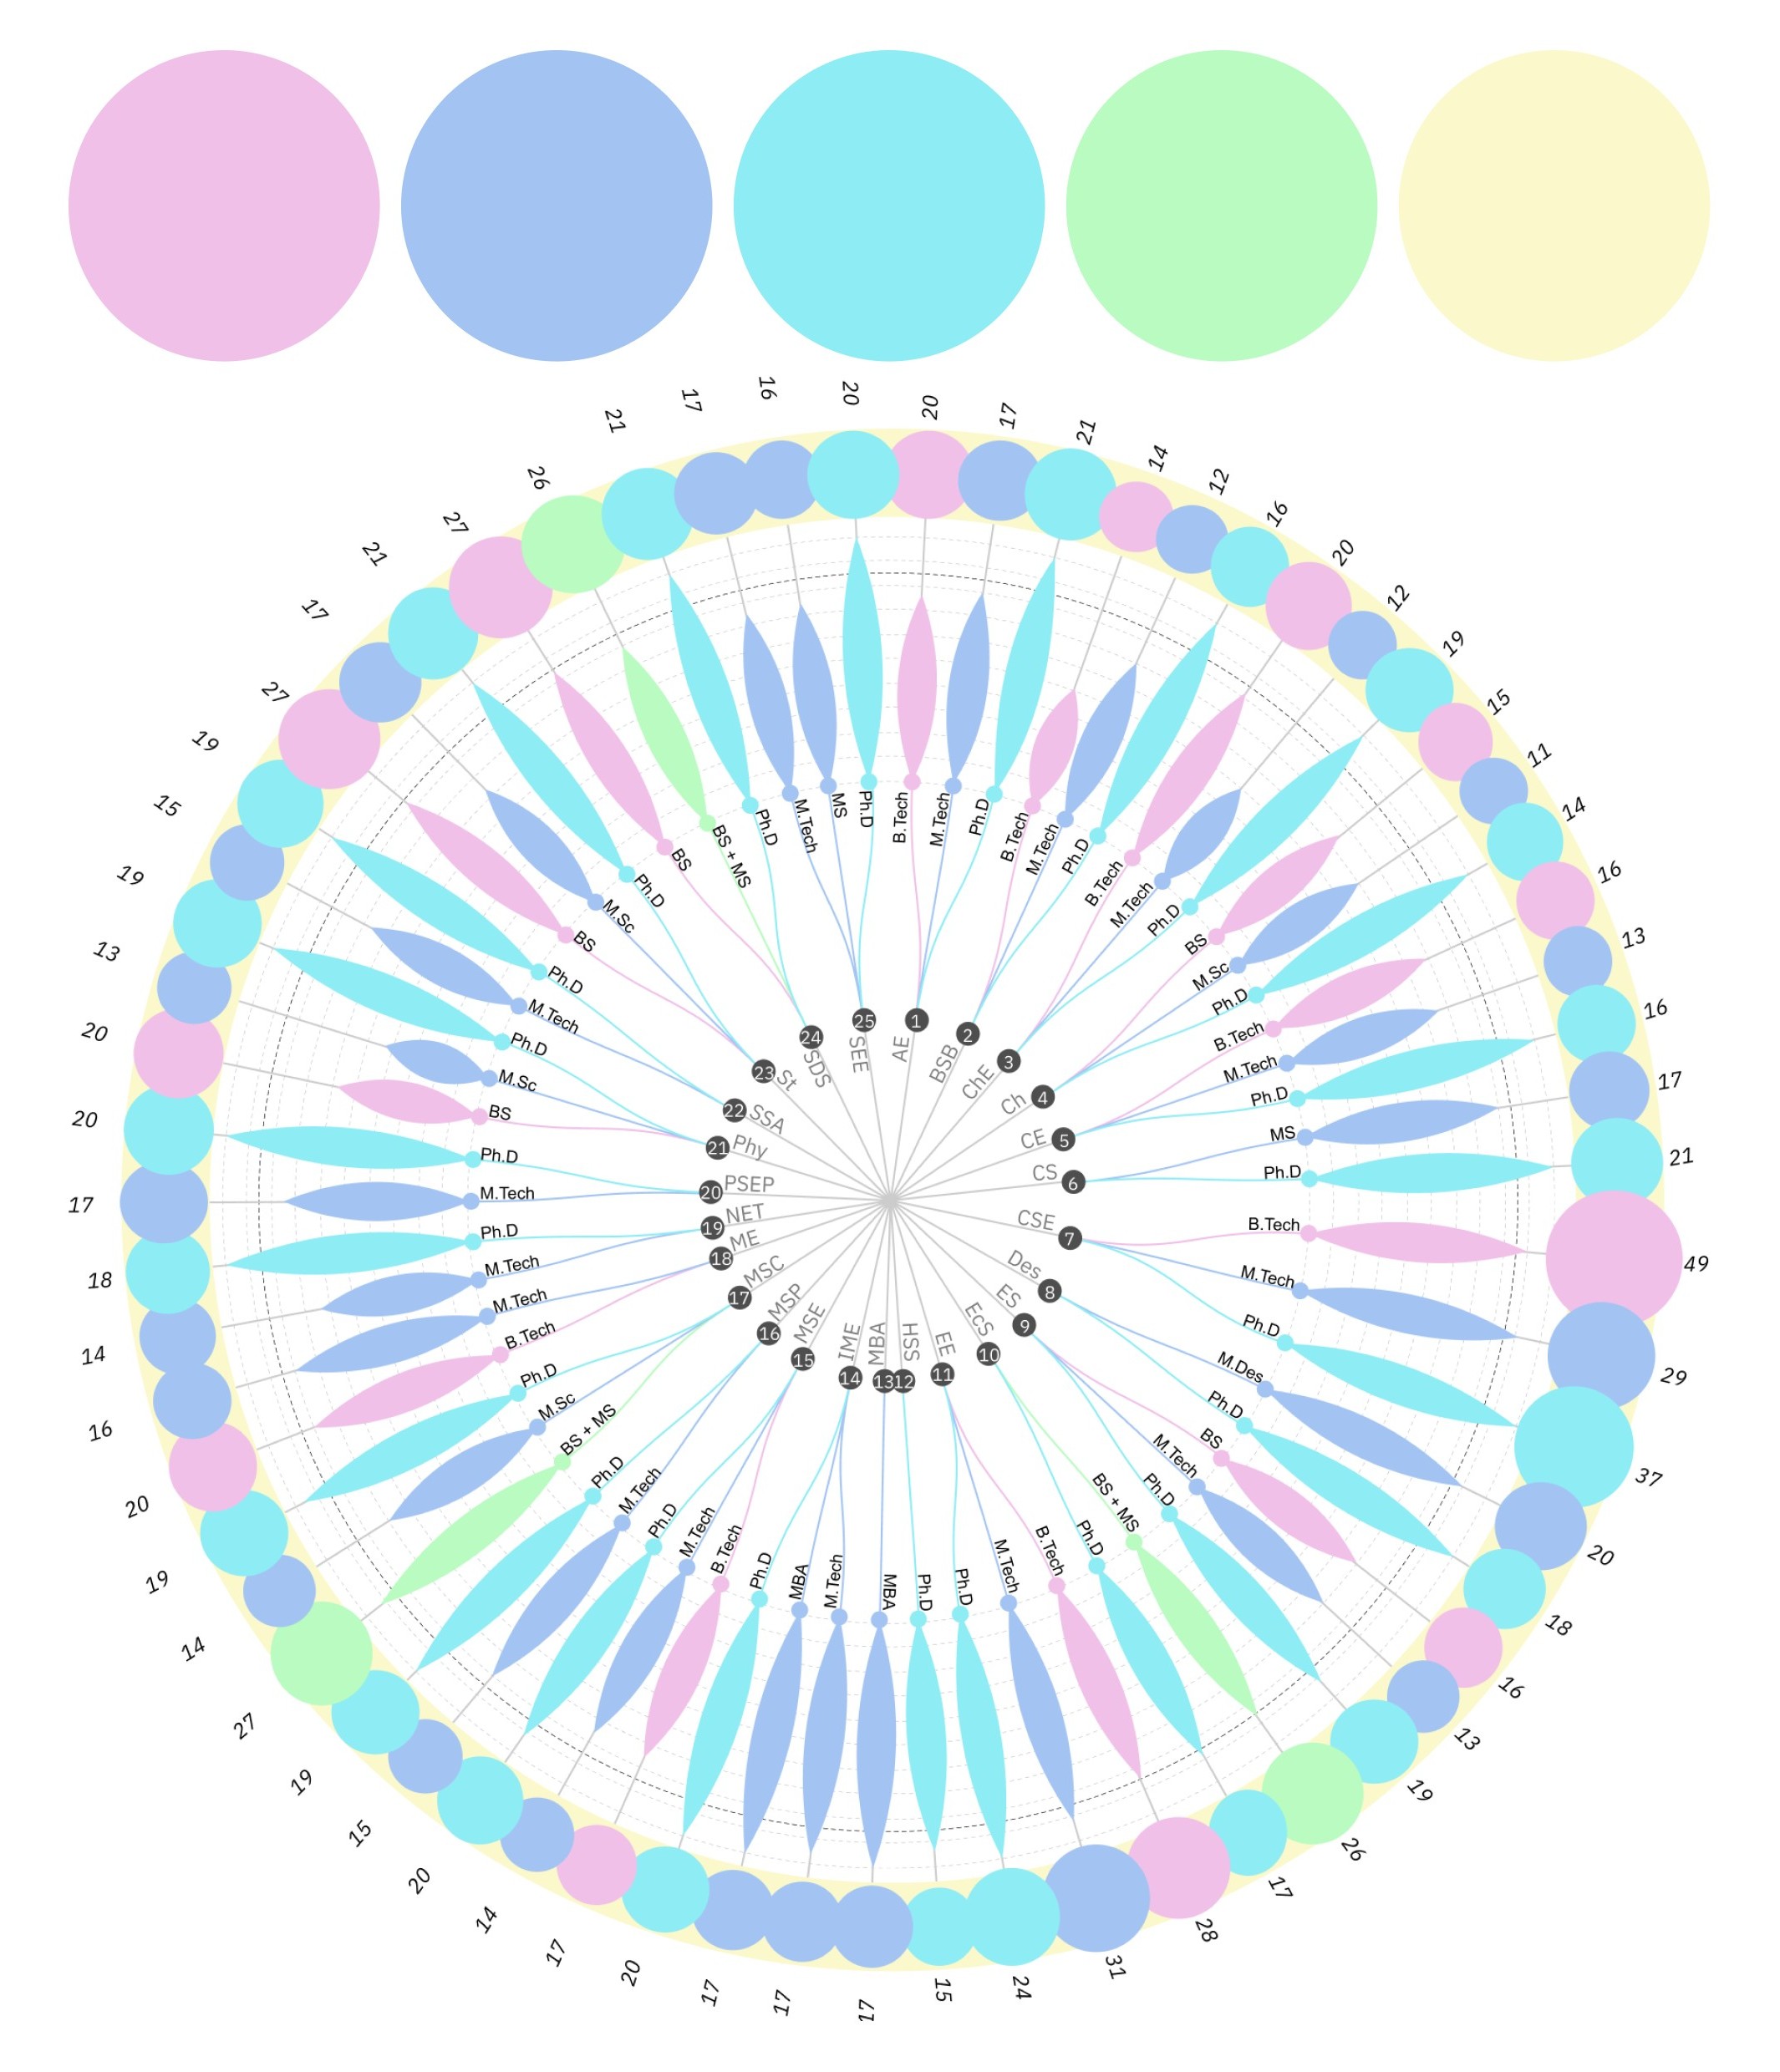
The same chart, dressed in nine different colour harmonies, from saturated jewel tones to soft pastels. Colours and legend were then refined for contrast and clarity before the final poster.

Colour exploration 1: burgundy, blue, cream, green, lavender
Colour harmony 1
Colour exploration 2: soft purple, sky blue, orchid, peach, cream
Colour harmony 2
Colour exploration 3: coral, pink, peach, salmon, deep blue
Colour harmony 3
Colour exploration 4: navy, blue, indigo, green, yellow
Colour harmony 4
Colour exploration 5: wine, rose, pink, apricot, mint
Colour harmony 5
Colour exploration 6: lilac, periwinkle, aqua, mint, butter
Colour harmony 6
Colour exploration 7: pink, amber, lime, teal, lavender
Colour harmony 7
Colour exploration 8: pink, orange, aqua, lilac, lemon
Colour harmony 8
Colour exploration 9: peach, lavender, pink, powder blue, yellow
Colour harmony 9
03 / The poster

The full A1 poster.

Click any department to open its chain of programmes, with specialisation, share placed and average annual package. Hover to see what is connected.

IIT Kanpur Placement Data (2024–25) poster with legend, radial chart and department key